


Trend analysis (fig. 1).
On Wednesday, the pair may try to grow from the level of 1.2311 (the closing of yesterday's daily candlestick) to the Fibonacci retracement level of 38.2%, 1.2403 (yellow dotted line). If the pair breaks above this level, it could approach the target level of 1.2447, which is the Fibonacci retracement level of 50.0% (red dotted line).
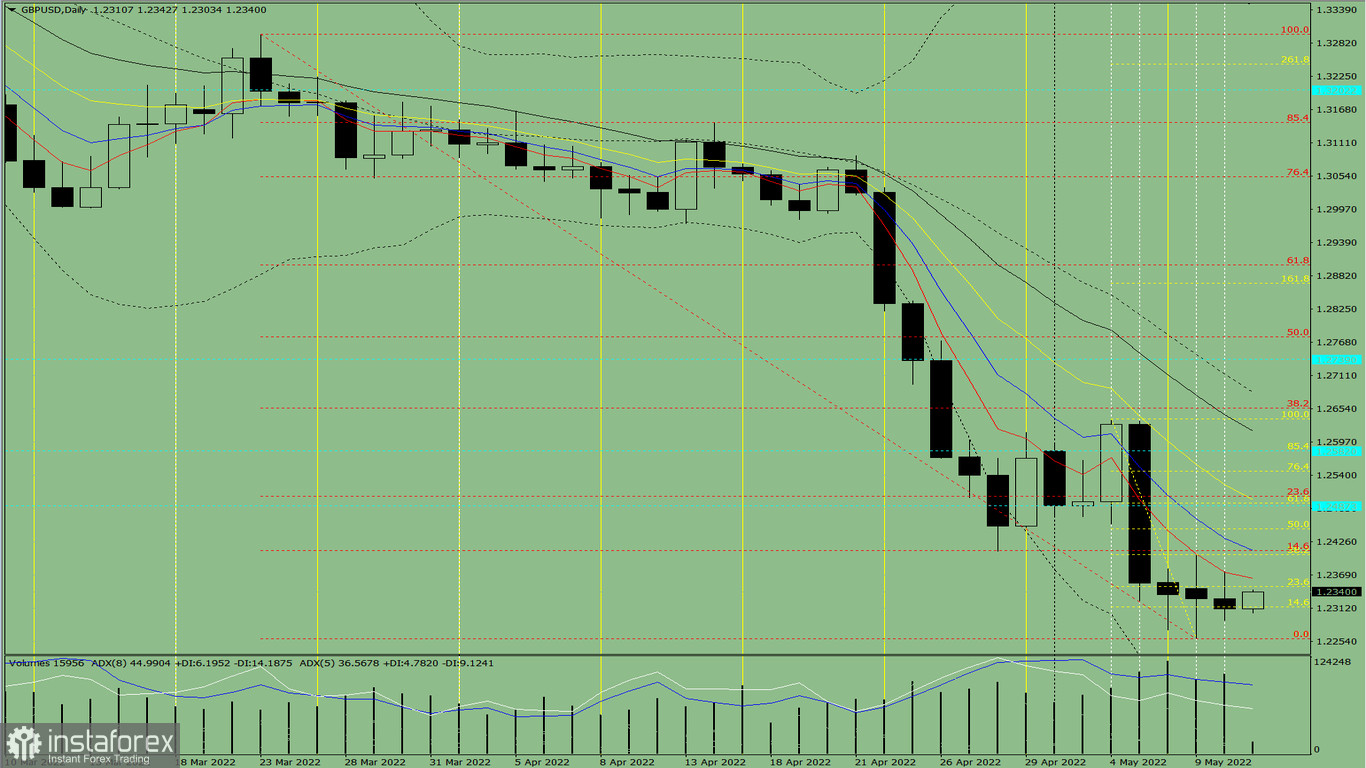
Fig. 1 (daily chart).
Complex analysis:
- indicator analysis - up;
- Fibonacci retracement levels – up;
- trading volumes – up;-
- candlestick analysis – up;
- trend analysis – up;
- weekly chart–up;
- Bollinger bands – up.
Conclusion:
Today, the pair may try to grow from the level of 1.2311 (the closing of yesterday's daily candlestick) to the Fibonacci retracement level of 38.2% or 1.2403 (yellow dotted line). If the pair breaks above this level, it could approach the target level of 1.2447, which is the Fibonacci retracement level of 50.0% (red dotted line).
Alternatively, the price may climb from the level of 1.2311 (the closing of yesterday's daily candlestick) to the Fibonacci retracement level of 23.6% or 1.2248 (yellow dotted line). If the pair breaks through this level, it is likely to retreat to 1.2260 (red dotted line) and then resume growth.


