


Trend analysis (Fig. 1).
The euro-dollar pair may move down from the level of 1.0512 (close of yesterday's daily candle) to test the lower fractal 1.0471 (red dotted line). From this level, the price may move up with a target of 1.0577, the 14.6% retracement level (red dotted line). When testing this level, the price may continue to move upward to test 1.0641, the 23.6% retracement level (red dotted line). From here, a downward pullback is possible.
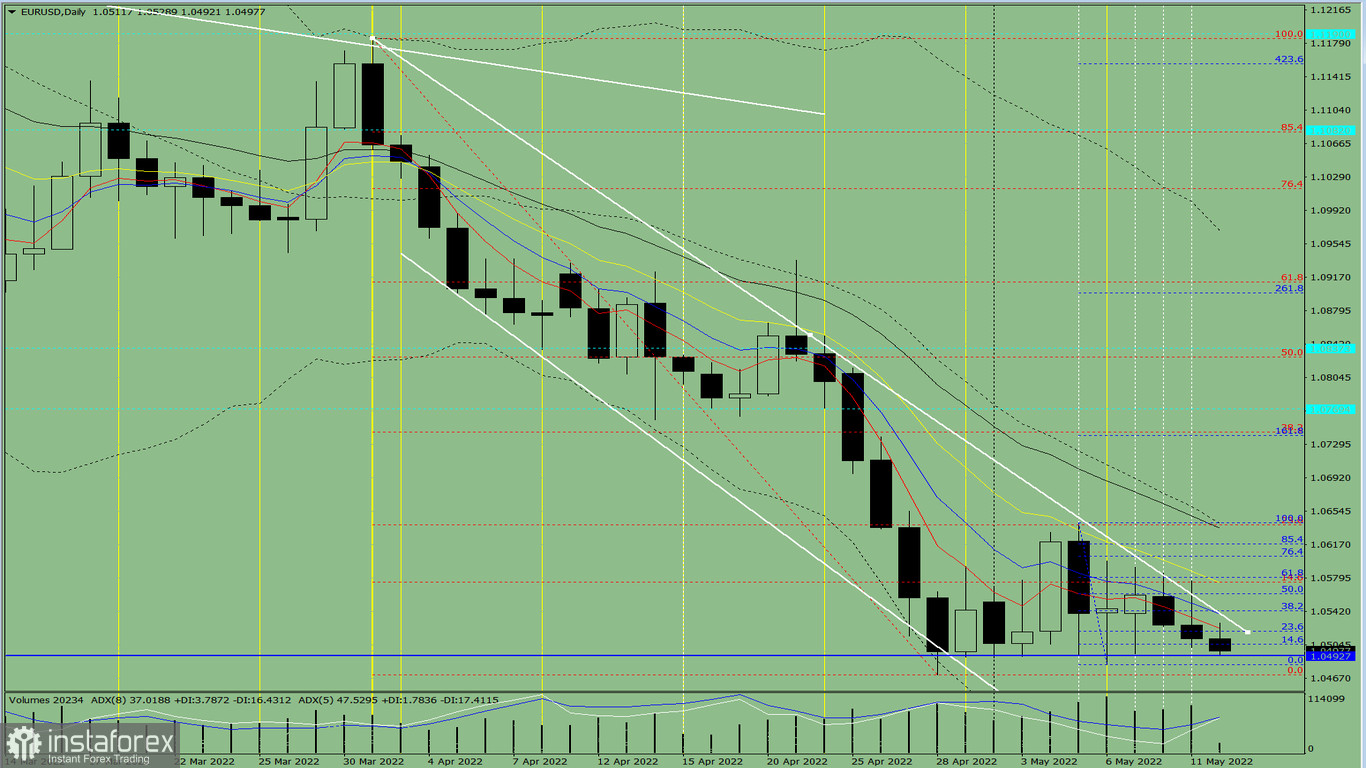
Fig. 1 (daily chart).
Comprehensive analysis:
- Indicator analysis – down;
- Fibonacci levels – down;
- Volumes – down;
- Candlestick analysis – down;
- Trend analysis – up;
- Bollinger bands – up;
- Weekly chart – up.
Today, the price may move down from the level of 1.0512 (close of yesterday's daily candle) to test the lower fractal 1.0471 (red dotted line). From this level, the price may move up with a target of 1.0577, the 14.6% retracement level (red dotted line). When testing this level, the price may continue to move upward to test 1.0641, the 23.6% retracement level (red dotted line). From here, a downward pullback is possible.
Alternative scenario: from the level of 1.0512 (close of yesterday's daily candle), the price may move downward to the support at 1.0493 (thick blue line). When testing this level, the price may move up to test 1.0577, the 14.6% retracement level (red dotted line). From here, the price may continue to move up.

