Bitcoin continues its downward trend amid tightening monetary policy and the war in Ukraine. We assumed that the asset and the market will make a small upward rebound due to a slight correction in DXY and a possible publication of financial statements. However, the market decided otherwise, and the price went to update the next local bottom. From this, we can conclude that the US dollar is becoming the main asset for the next year and any negative news regarding this asset provokes negative in the stock and cryptocurrency markets.
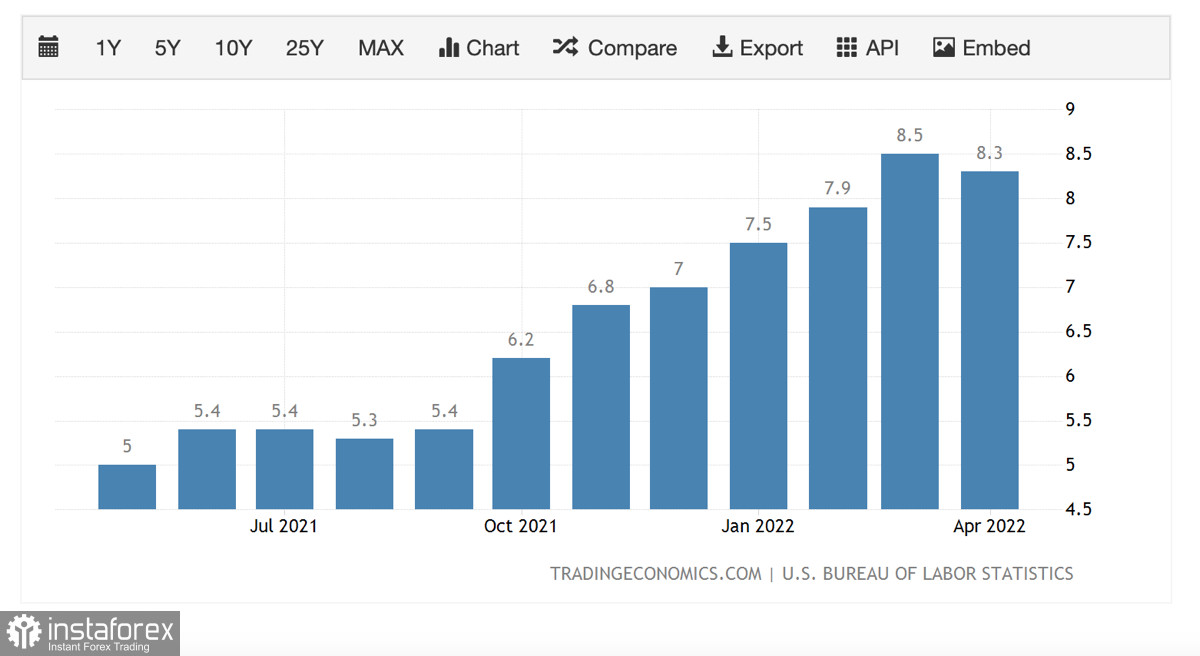
According to the report on the growth of consumer prices, the inflation rate rose to 8.3% instead of the expected 8.1%. Immediately after the publication of the report, Bitcoin updated the local bottom below $29k. As of May 12, BTC/USD is quoted at around $27k. This suggests that investors have taken a negative view of inflation reporting, which runs counter to Fed Chairman Jerome Powell's statement that the Fed controls inflation. It is likely that now the agency may revise its current policy regarding the strengthening of the US dollar and raising the key rate.
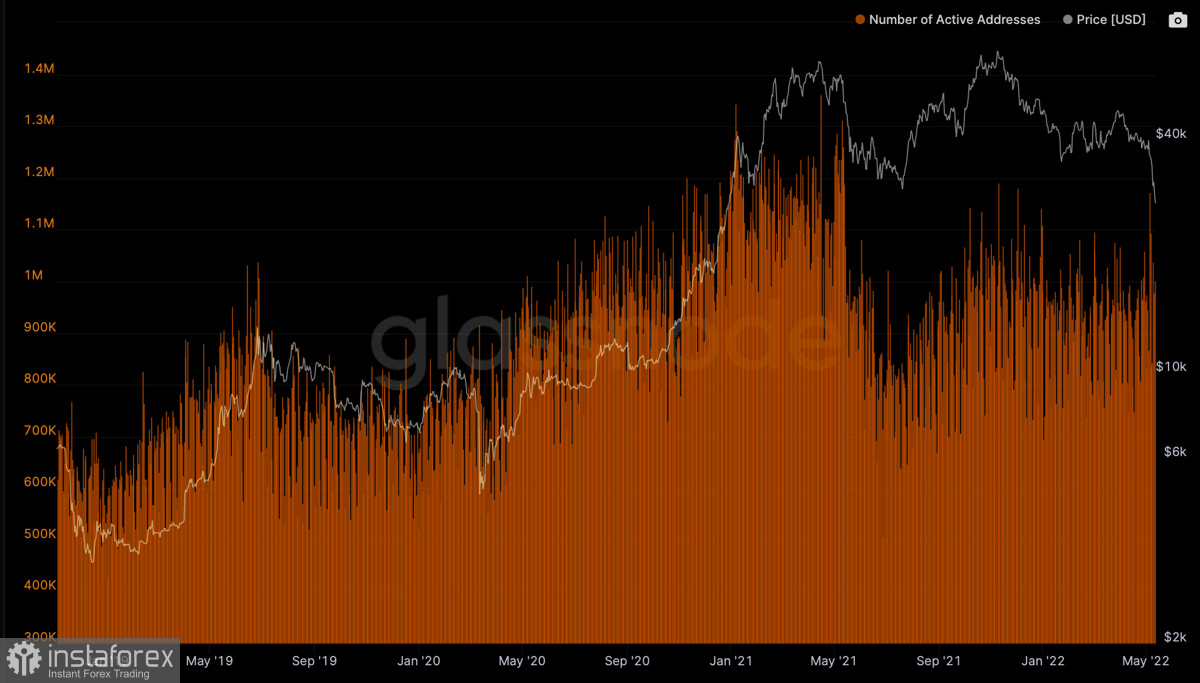
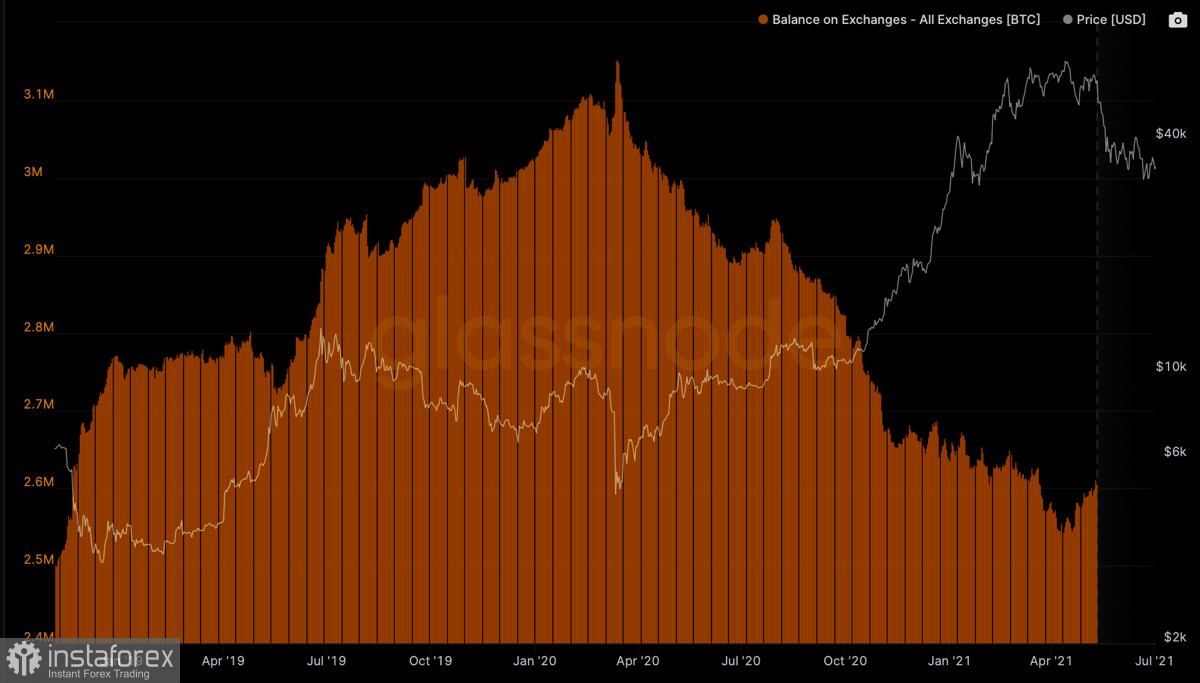
At the same time, the number of unique addresses in the BTC network continues to grow, and trading volumes have reached a record $83.7 billion. The influx of coins to the exchanges also continues. All of these factors point to an ongoing sell-off that has flared up with renewed vigor following the release of the inflation report. Massive cryptocurrency sales put additional pressure on the price, as a result of which Bitcoin will continue to fall. The next support zone for the asset will be the $24–$25k area.
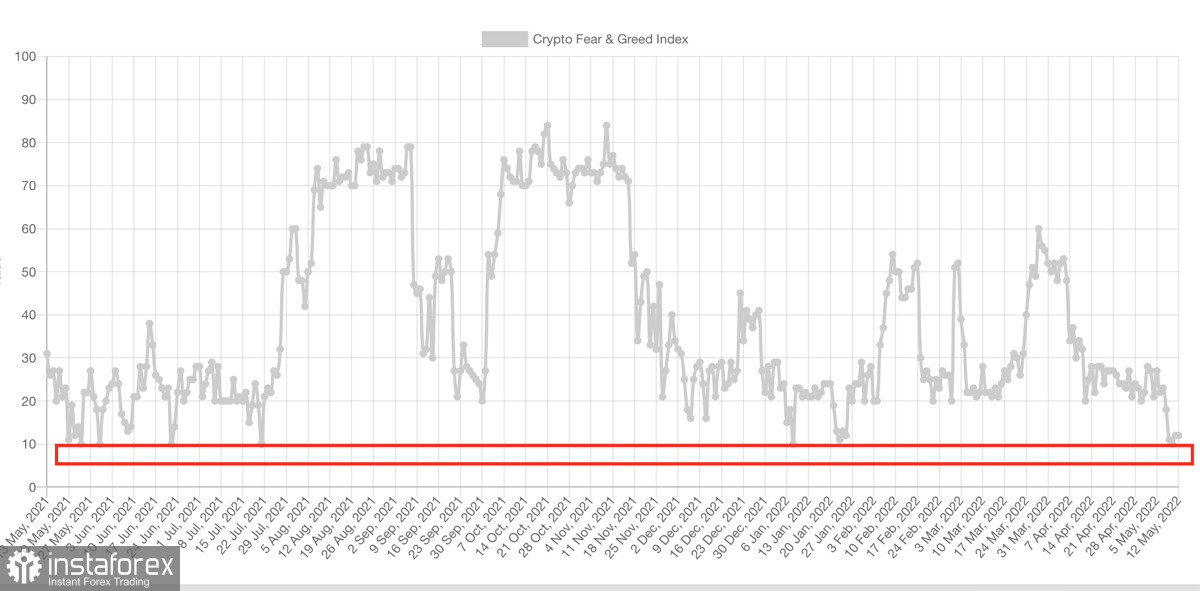
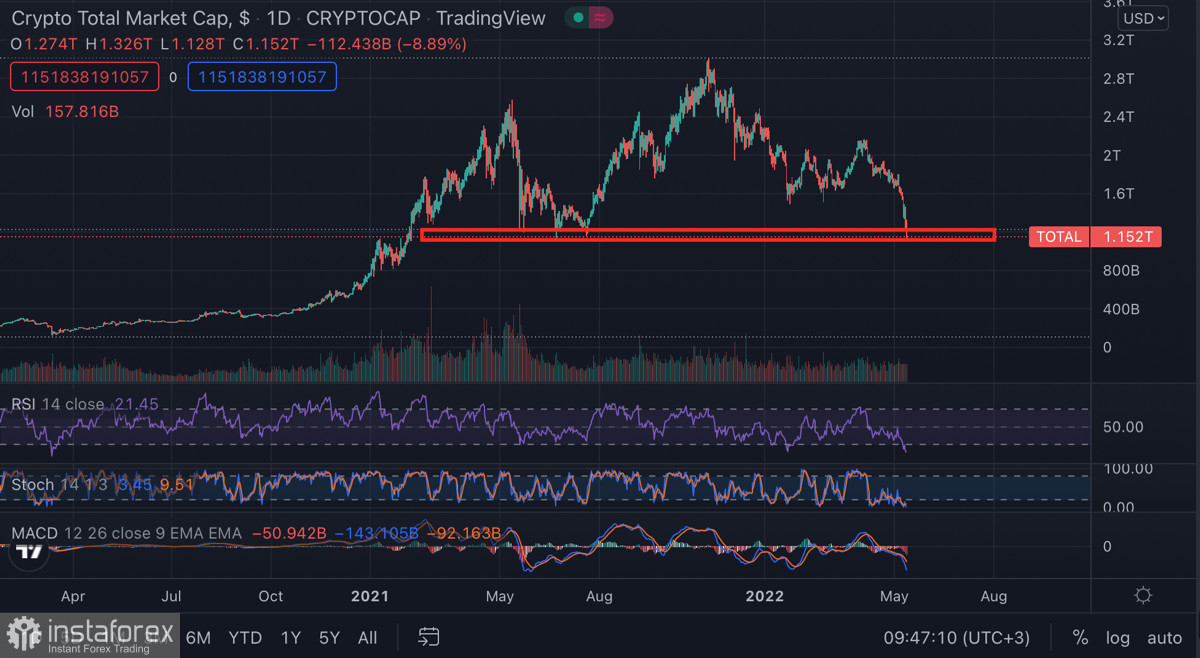
At the same time, all metrics tell us about the approach of Bitcoin to the local bottom. The fear and greed index reached an absolute minimum at 11-12. The capitalization of the crypto market also hit the $1.2 trillion mark. However, the further movement of the cryptocurrency market will depend entirely on the behavior of Bitcoin. And while the market is falling due to the Fed's policy and the reduction of liquidity in the markets, technically there are several bearish signals on Bitcoin.
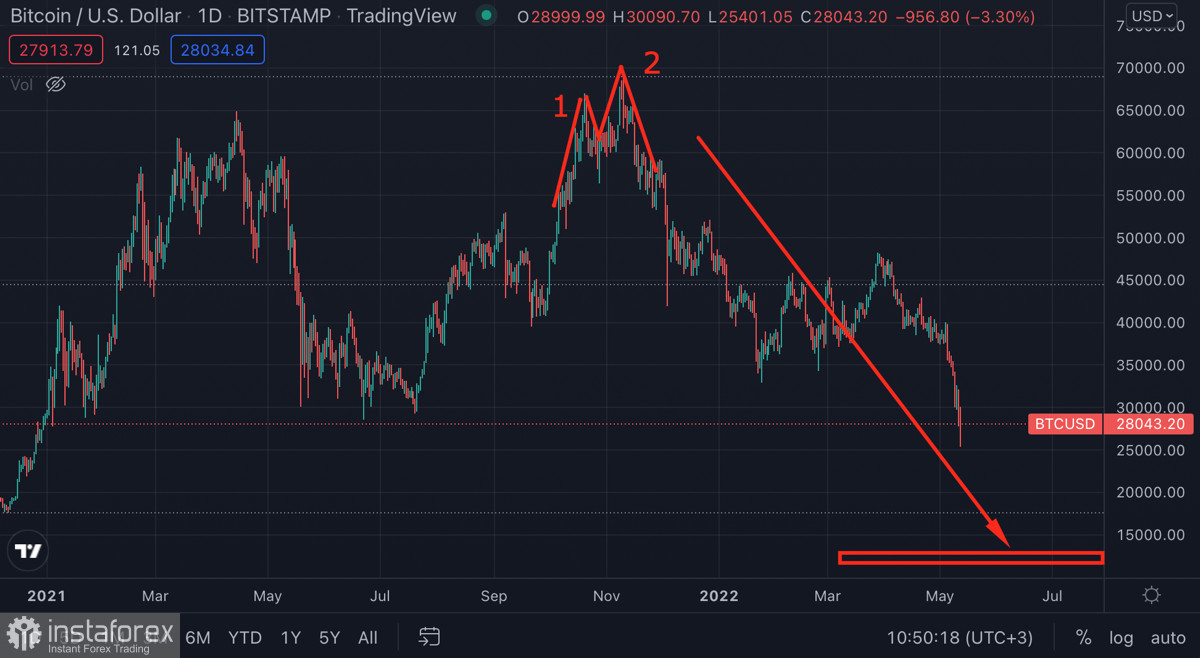
First of all, a "double top" large-scale pattern formed on the daily timeframe, which is a bearish signal. The potential for price reduction in the implementation of this formation is in the region of $14k–$15k. The market has already worked out most of the potential of this figure, but despite this, the fall continues.
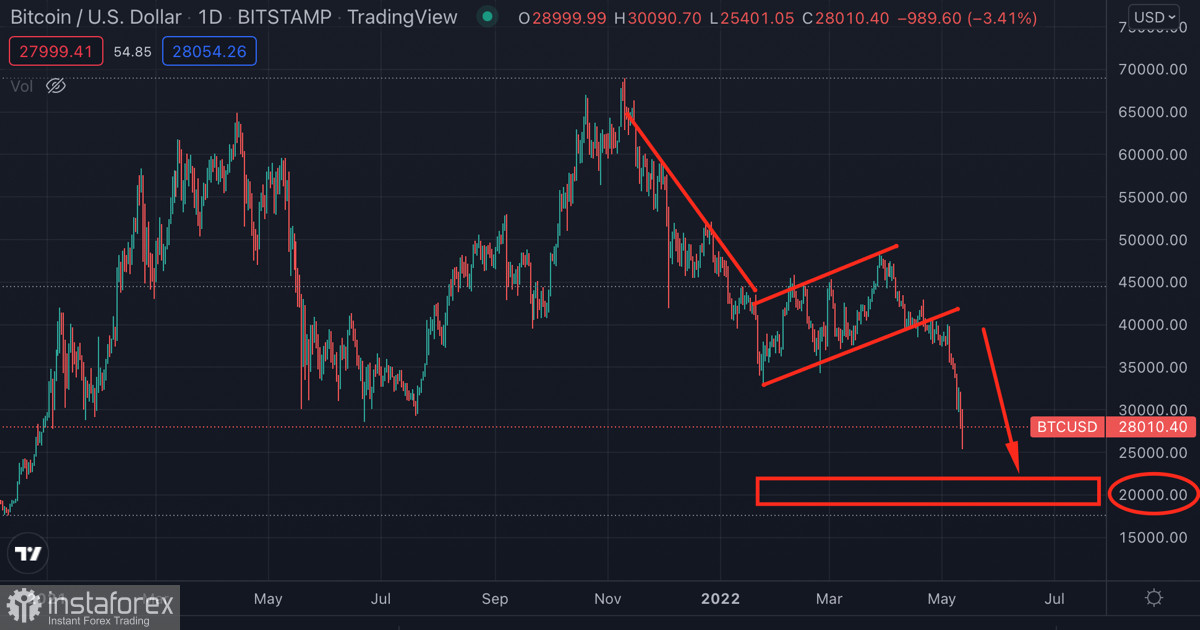
In addition, on the same daily chart, a bear flag pattern formed with a downside potential around $20k. Given the presence of two bearish patterns and extremely negative news and fundamental background, there is no doubt that the price will continue to fall. Most likely, the asset will break through the $24k–$25k support zone and continue its downward movement.
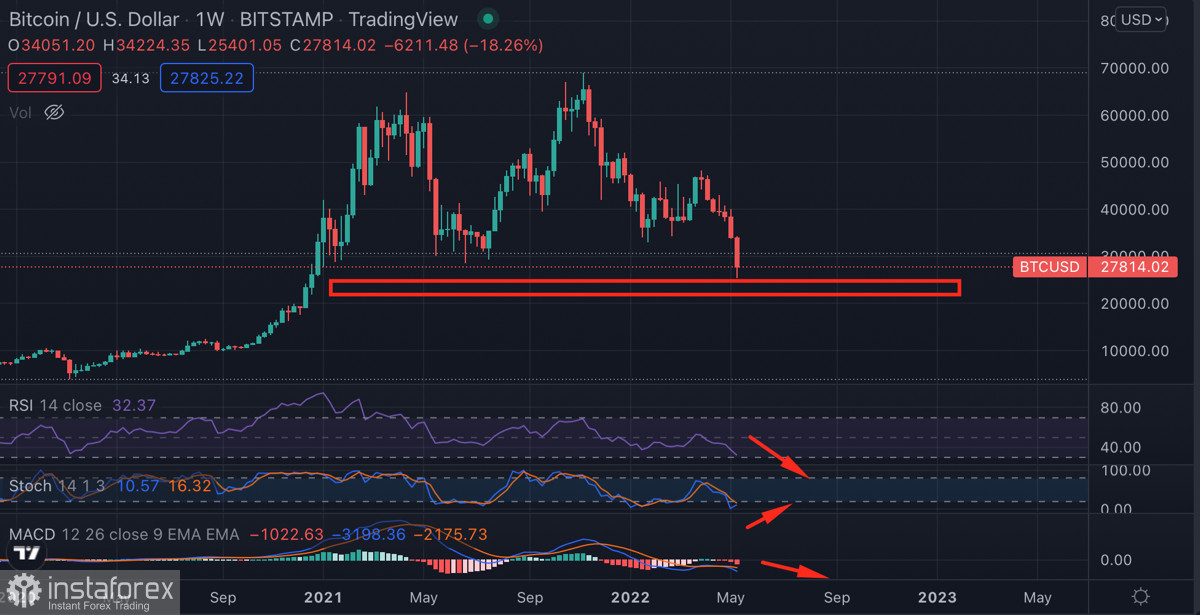
On the weekly chart, we can see that the main area of $26k–$28k is still standing and the price has rebounded from the lower boundary, forming a long lower wick. However, on the weekly timeframe, we see a drop in purchases and a gradual decline in RSI into the overbought zone. At the same time, we see a divergence between the MACD and the stochastic oscillator. This probably suggests that the current short-term momentum will not succeed over the long-term bearish trend. In such a situation, you need to mentally prepare for a decline to the $15k–$20k area, and protect your capital and average positions on discounts of the bearish cryptocurrency market.