


The British pound fell to its lowest level in two years against the US dollar and hit a 7-month low against the euro following the release of UK GDP data.
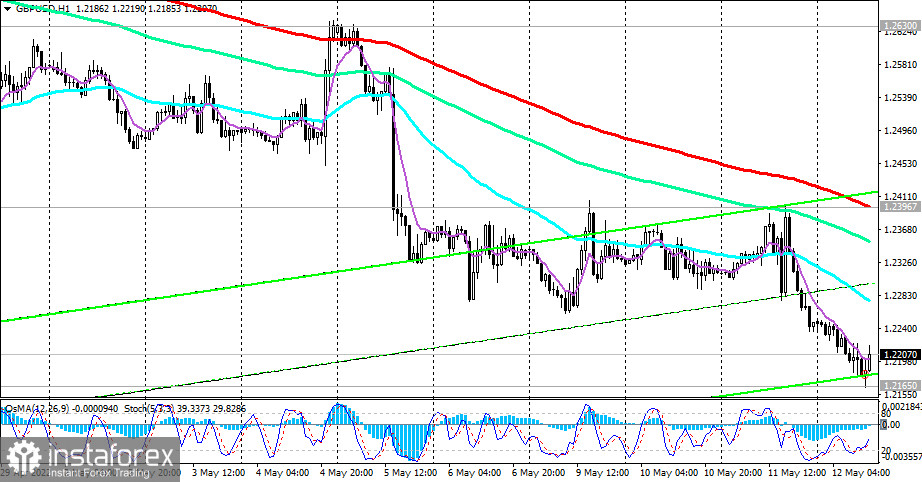
At the time of writing this article, GBP/USD was near 1.2207, 42 pips above today's low reached at the start of the European session.
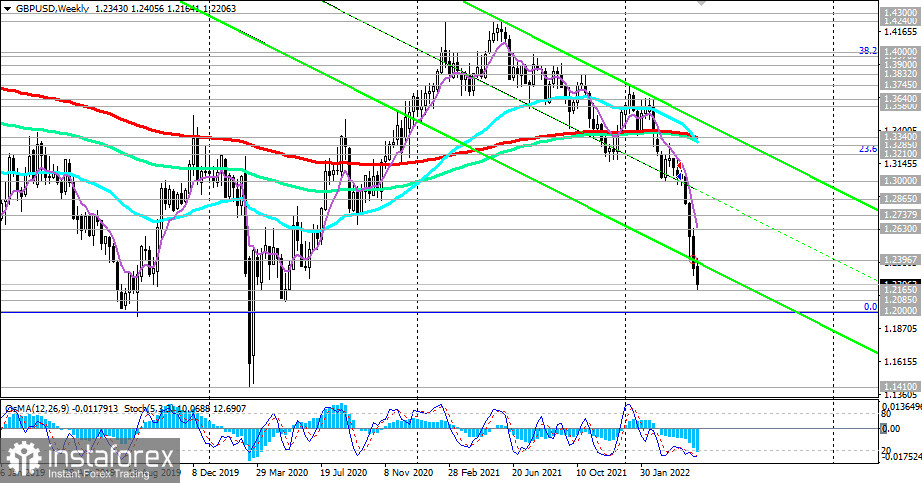
Last week, the price broke through the lower limit of the descending channel on the weekly chart (near 1.2396), and today it is testing the lower limit of the descending channel on the daily chart, passing through 1.2235, for a breakdown.
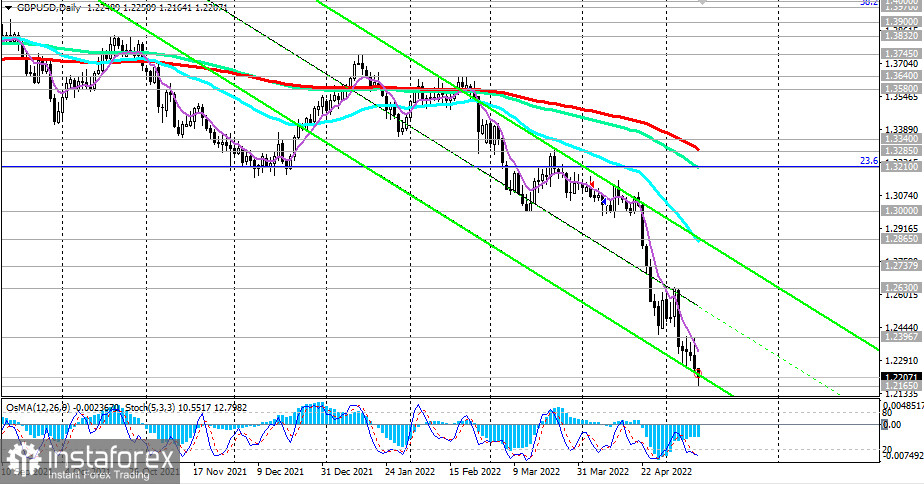
Thus, the dynamics of the decline is accelerating, and GBP/USD is moving towards the local support levels of 1.2085, 1.2000. In the review for 04/22/2022, we wrote that more distant targets for the GBP/USD decline are located at local support levels 1.2250, 1.2085, 1.2000 (the low in the GBP/USD decline wave that began in July 2014 near the level of 1.7200). It looks like our scenario is coming true.
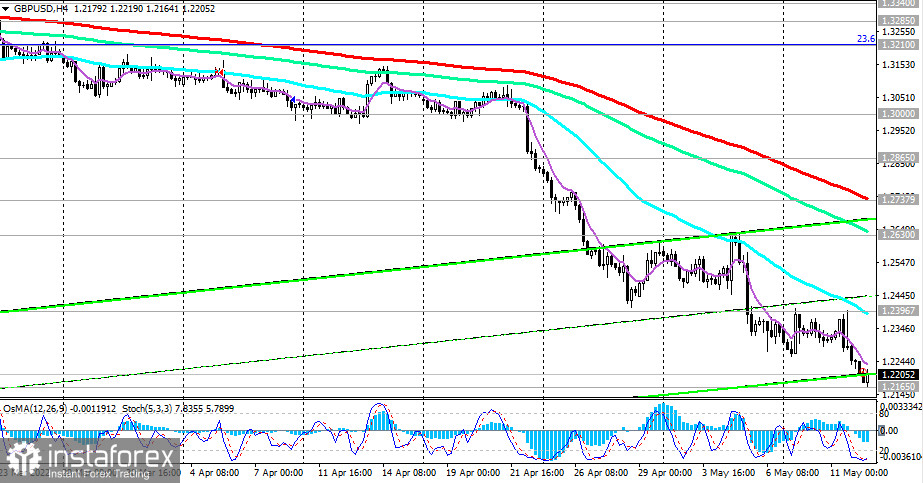
In an alternative scenario, and after the breakdown of the resistance level of 1.2396, GBP/USD will resume growth. The target of this upward correction may be resistance levels 1.2630, 1.2738 (200 EMA on the 4-hour chart), 1.2865 (upper limit of the descending channel and 50 EMA on the daily chart), and 1.3000 (local resistance level).
However, only growth in the zone above the resistance levels of 1.3285 (200 EMA on the daily chart), and 1.3340 (200 EMA on the weekly chart) can reverse the situation, increasing the probability of GBP/USD growth in the long-term bull market zone, above the key resistance level of 1.4580 (200 EMA on the monthly chart and the 50% Fibonacci retracement to the decline of GBP/USDUSD in the wave that began in July 2014 near the level of 1.7200).
Support levels: 1.2165, 1.2100, 1.2085, 1.2000
Resistance levels: 1.2396, 1.2630, 1.2738, 1.2865, 1.3000, 1.3210, 1.3285, 1.3340
Trading Tips
Sell Stop 1.2160. Stop-Loss 1.2250. Take-Profit 1.2100, 1.2085, 1.2000
Buy Stop 1.2250. Stop-Loss 1.2160. Take-Profit 1.2300, 1.2396, 1.2630, 1.2738, 1.2865, 1.3000, 1.3210, 1.3285, 1.3340


