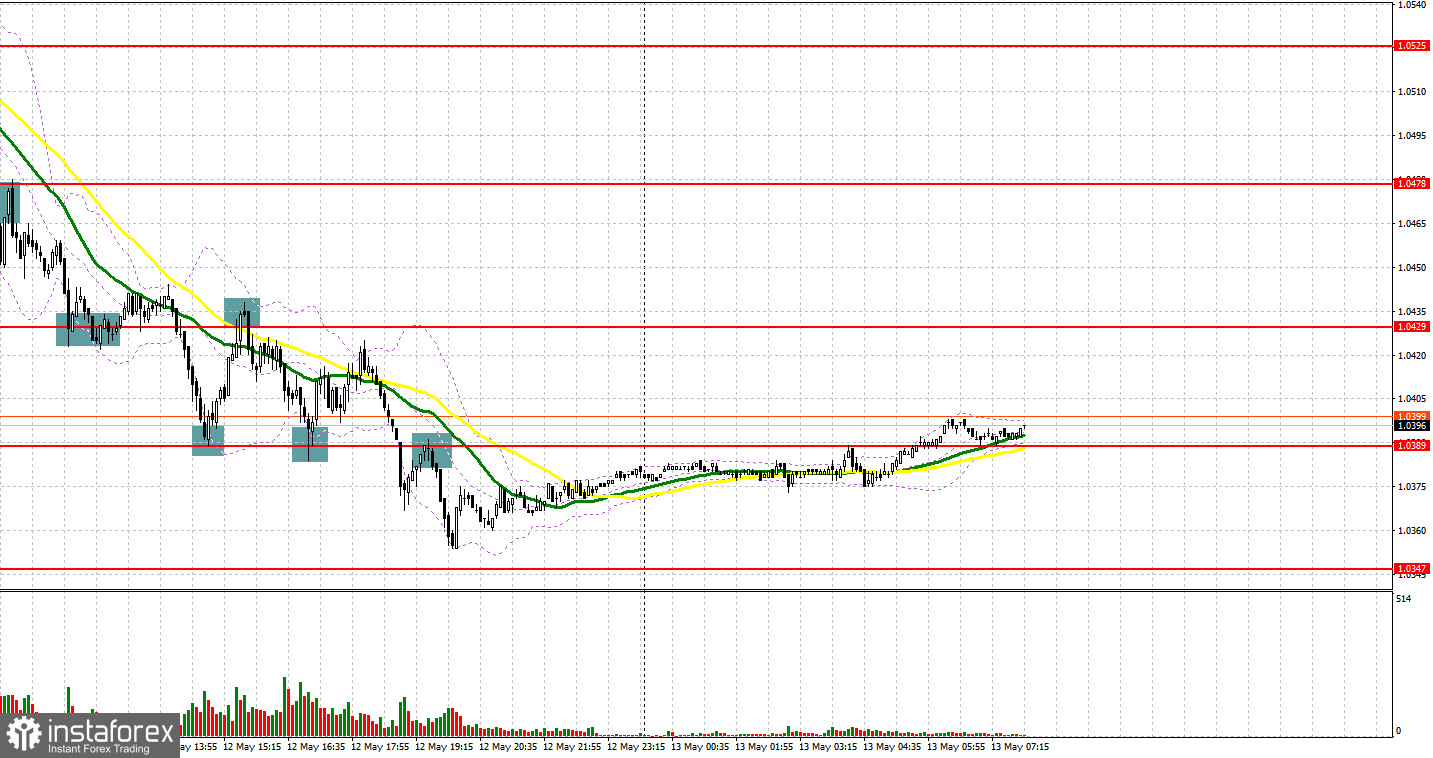
Yesterday was an interesting trading day and traders received many profitable signals to enter the market. Let us take a look at the 5-minute chart to clear up the market situation. Earlier, I asked you to pay attention to the level of 1.0473 to decide when to enter the market. Sellers of the euro managed to break the level of 1.473 thanks to a zero market reaction to Christine Lagarde's comments and absence of macroeconomic data from the eurozone. I advised you to go short after an upward test of this level. Thus, my predictions met reality and traders received about 40 pips of profit. The fact is that after an upward test of 1.0473, the euro/dollar pair dropped to the next support level of 1.0434. However, at this level, bulls showed high activity. As a result, a false break of the level led to a buy signal, but the price failed to jump. In the second part of the day, bears pushed the euro lower to 1.0389, where a false break gave a new buy signal. As a result, the pair increased by 40 pips to 1.1429. However, positive data on the US labor market allowed sellers to protect this level, forming a sell signal with a following decline to 1.0389. At this level, bulls formed a false break, providing traders with a buy signal. Only in the middle of the US trade, a downward test of 1.0389 gave an additional sell signal. After that, the pair decreased to a new yearly low of 1.0350. Notably, the next support level is located at 1.0347.

Conditions for opening long positions on EUR/USD:
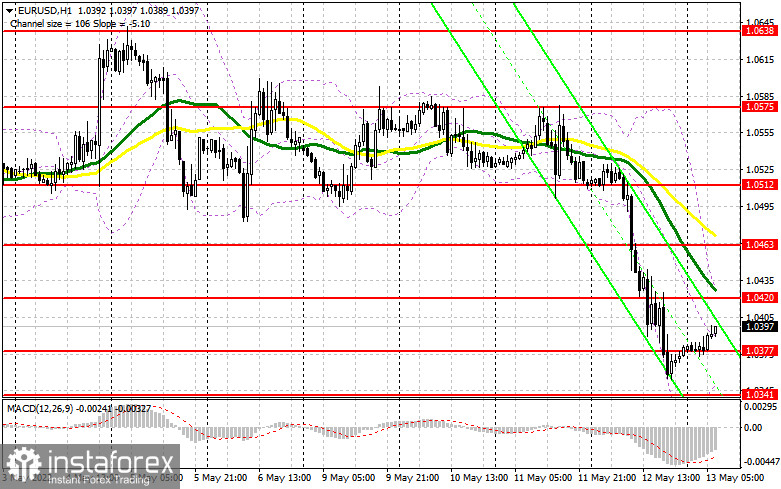
Yesterday, the US published mixed data on the PPI and the number of first-time claims. Although the number of claims increased, it was just an insignificant change that did not affect the market. As a result, demand for the US dollar remained high. Today, in the first part of the day, traders should pay attention to France's and Spain's CPI reports. Meanwhile, the eurozone industrial production data for March is likely to be ignored. In case of a rise in inflation, the euro is likely to continue its correction that we saw during the Asian trade. Today, buyers should primarily protect the support level of 1.0377. If the pair drops, only a false break of this level will give a perfect buy signal. In this case, the euro may recover to 1.0420. A break and a downward test of this level may give a new buy signal, allowing the pair to climb to 1.0463, where it is recommended to lock in profits. A farther target is located at the high of 1.0512. However, the pair will hardly reach this level, given the necessity of a more aggressive approach by the Fed. If the euro/dollar pair declines and bulls fail to protect 1.0377, it will be better to avoid long positions. Traders may go long after a false break near a new yearly low of 1.0341. Long positions could also be initiated from 1.0306 or lower – from 1.0255, expecting a rise of 30-35 pips.
Conditions for opening short positions on EUR/USD:
Yesterday, after the publication of the US macroeconomic reports, sellers remained very active. The fact is that a rise in producer prices proved the necessity of further monetary policy tightening by the Fed. Today, traders should primarily protect the nearest resistance level of 1.0420. A false break of this level may return pressure on the euro and push it to the intermediate support level of 1.0377. If bulls fail to be active, in the first part of the day, the pair may slide to new yearly lows. A break and settlement below 1.0377 as well as an upward test of this level will give a new sell signal. In this case, the pair may slump to the low of 1.0341, where it is recommended to lock in profits. A farther target is located at 1.0306. If the euro/dollar pair increases in the first part of the day amid strong inflation data from the eurozone and bears fail to protect 1.0420, nothing important will happen. However, the pair may skyrocket. Thus, it will be wise to go short after a false break of 1.0463. It is also possible to sell the pair from 1.0512 or higher – from 1.0575, expecting a drop of 30-35 pips.

COT report
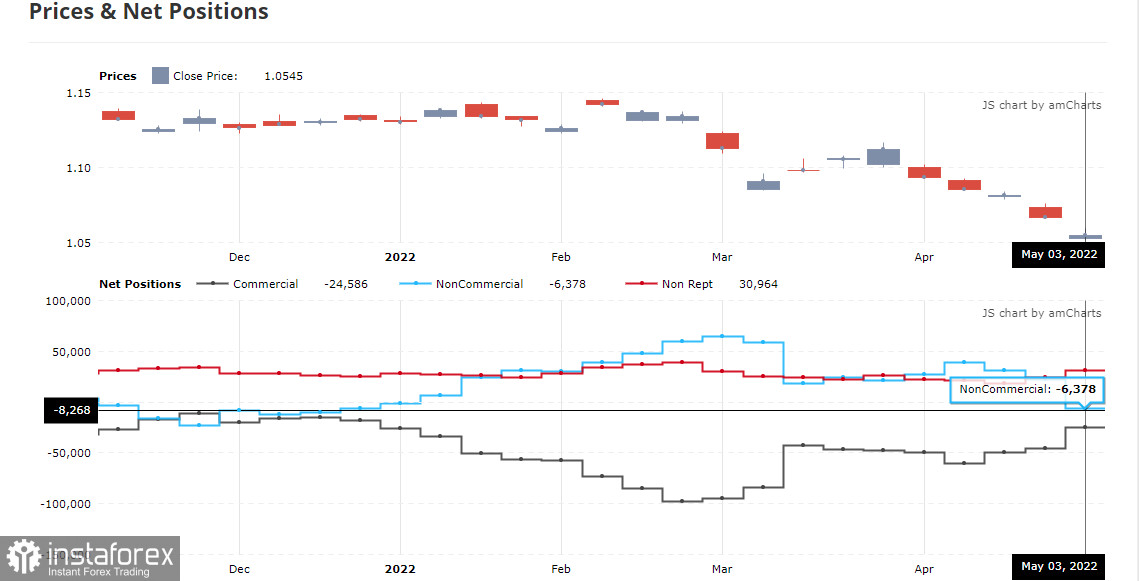
According to the COT report from May 3, the number of short positions surged, whereas the number of long positions declined. The recent announcements made by central banks spurred a sell-off of risk assets. The fact is that it became obvious that developed economies will hardly avoid grave problems. A sharp increase in the US key interest rate by 0.5% made investors focus on the US dollar as a safe-haven asset. High inflation is a serious problem not only for the US, but also for the whole world. In addition, rapid tightening of the Fed's monetary policy is making the greenback attractive for investors. The ECB President also pinpointed the necessity of a faster change in monetary policy. It is expected that the central bank will discontinue asset purchases by the end of the second quarter of the year. The first key interest rate hike is planned to take place this autumn. While the ECB is just planning, the Federal Reserve is taking measures. Against the backdrop, the greenback is becoming more and more attractive. However, a lot will depend on the US inflation report and market reaction. If inflation falls a bit, pressure on the euro may become weaker, thus boosting risk assets and allowing the euro to form an upward correction. In the latest reporting week to May 5, the number of long positions dropped to 208,449 from 221,003, whereas the number of short positions soared to 214,827 from 189,702. Notably, the euro's low price is making it attractive for traders. That is why the asset remains in demand despite the dominance of the bearish sentiment. According to the week's results, total non-commercial net position decreased to -6,378. The weekly close price slumped to 1.0545 from 1.0667.

Signals of indicators:
Moving Averages
Trading is performed below 30- and 50-day moving averages, thus pointing to a return of pressure on the euro.
Note: The period and prices of moving averages are considered by the author on the one-hour chart that differs from the general definition of the classic daily moving averages on the daily chart.
Bollinger Bands
A break of the lower limit of the indicator located at 1.0341 may cause a new decline in the euro.
Description of indicators
- Moving average (moving average, determines the current trend by smoothing volatility and noise). The period is 50. It is marked in yellow on the chart.
- Moving average (moving average, determines the current trend by smoothing volatility and noise). The period is 30. It is marked in green on the graph.
- MACD indicator (Moving Average Convergence/Divergence - convergence/divergence of moving averages). A fast EMA period is 12. A slow EMA period is 26. The SMA period is 9.
- Bollinger Bands. The period is 20.
- Non-profit speculative traders are individual traders, hedge funds, and large institutions that use the futures market for speculative purposes and meet certain requirements.
- Long non-commercial positions is a total number of long positions opened by non-commercial traders.
- Short non-commercial positions is a total number of short positions opened by non-commercial traders.
- The total non-commercial net position is a difference in the number of short and long positions opened by non-commercial traders.


