


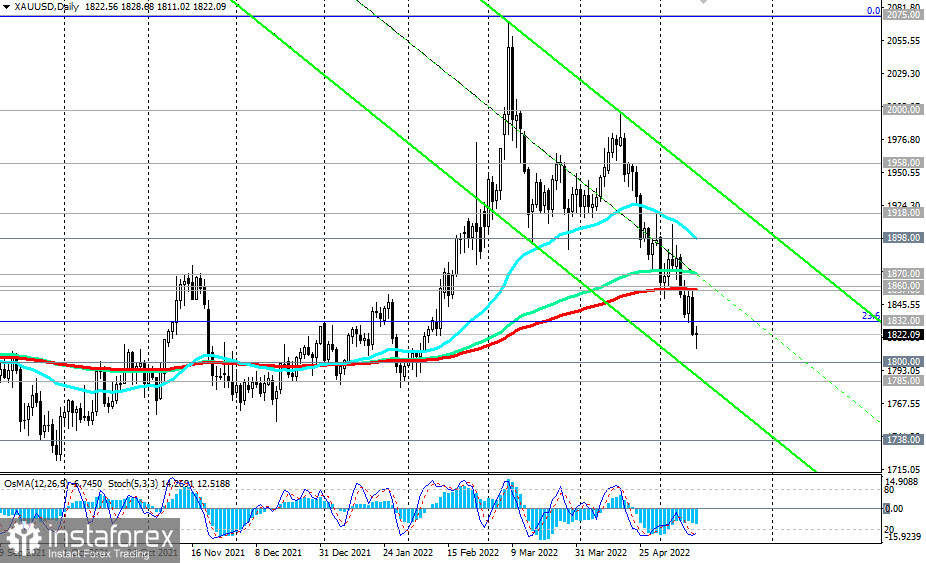
As suggested in the previous review of this pair, in an alternative scenario, and after the breakdown of the 1851.00 support level, XAU/USD will continue to decline towards the recent balance line passing through the 1800.00 mark. This scenario turned out to be working, and the price is moving, as assumed, towards the 1800.00 mark. The recommendation (Sell Stop 1869.00. Stop-Loss 1902.00) came true and the first downside targets at 1858.00, 1851.00, 1832.00 were achieved.
Let's not guess whether the price will reach the levels of 1800.00 and 1785.00, but again we will build our trading plan, assuming two scenarios for the development of events.
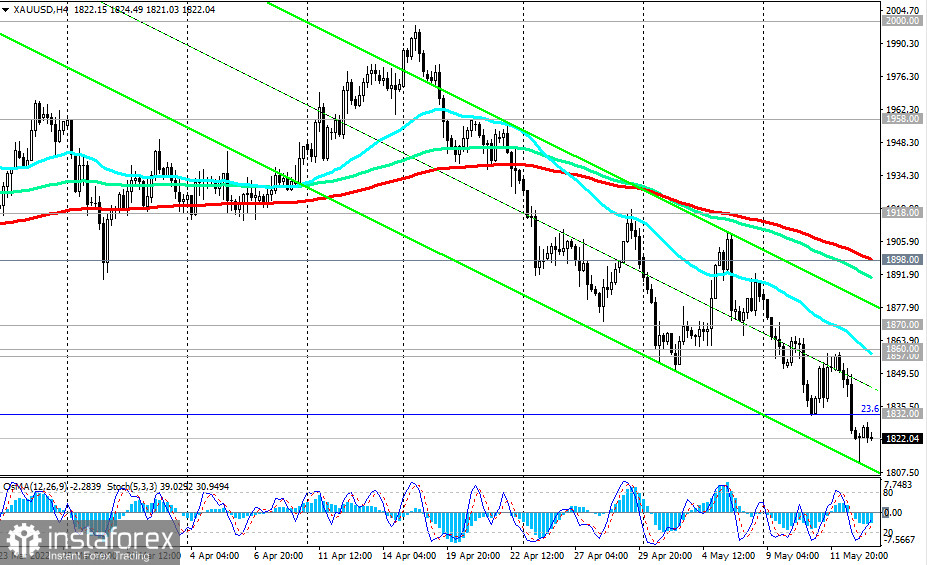
XAU/USD is trading near the 1821.00 mark, moving inside descending channels. The lower limit of the descending channel on the daily chart is between 1800.00 and 1785.00. If the downward trend continues, and everything is heading towards this, then the 1800.00 and 1785.00 marks are likely to become the nearest downward targets.
The signal for the implementation of this scenario will be a breakdown of the local support level and today's low of 1811.00.
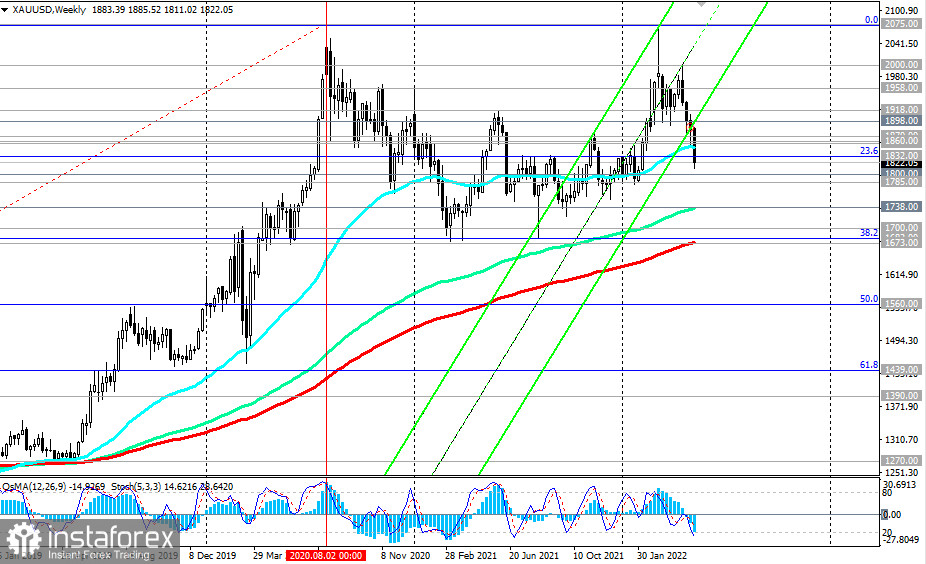
The breakdown of the support levels of 1800.00 and 1785.00 will strengthen the negative dynamics of XAU/USD, sending it towards the key long-term support levels of 1738.00 (144 EMA on the weekly chart), 1682.00 (38.2% Fibonacci retracement to the growth wave from December 2015 and the level of 1050.00), 1675.00 (200 EMA on the weekly chart). In turn, their breakdown will increase the risks of breaking the long-term bullish trend of XAU/USD.
In an alternative scenario and after the breakdown of the resistance level of 1857.00 (200 EMA on the daily chart), XAU/USD will return to the bull market zone. A break of the resistance level of 1870.00 (144 EMA on the daily chart) will confirm the revival of the long-term bullish trend.
The signal for the implementation of this scenario will be a breakdown of the resistance level of 1832.00 (local highs and the 23.6% Fibonacci retracement level).
Support levels: 1800.00, 1785.00, 1738.00, 1700.00, 1682.00, 1675.00
Resistance levels: 1832.00, 1857.00, 1860.00, 1870.00, 1898.00, 1918.00, 1958.00, 2000.00, 2070.00, 2075.00
Trading Tips
Sell Stop 1809.00. Stop-Loss 1834.00. Take-Profit 1800.00, 1785.00, 1738.00, 1700.00, 1682.00, 1675.00
Buy Stop 1834.00. Stop-Loss 1809.00. Take-Profit 1857.00, 1860.00, 1870.00, 1898.00, 1918.00, 1958.00, 2000.00, 2070.00, 2075.00


