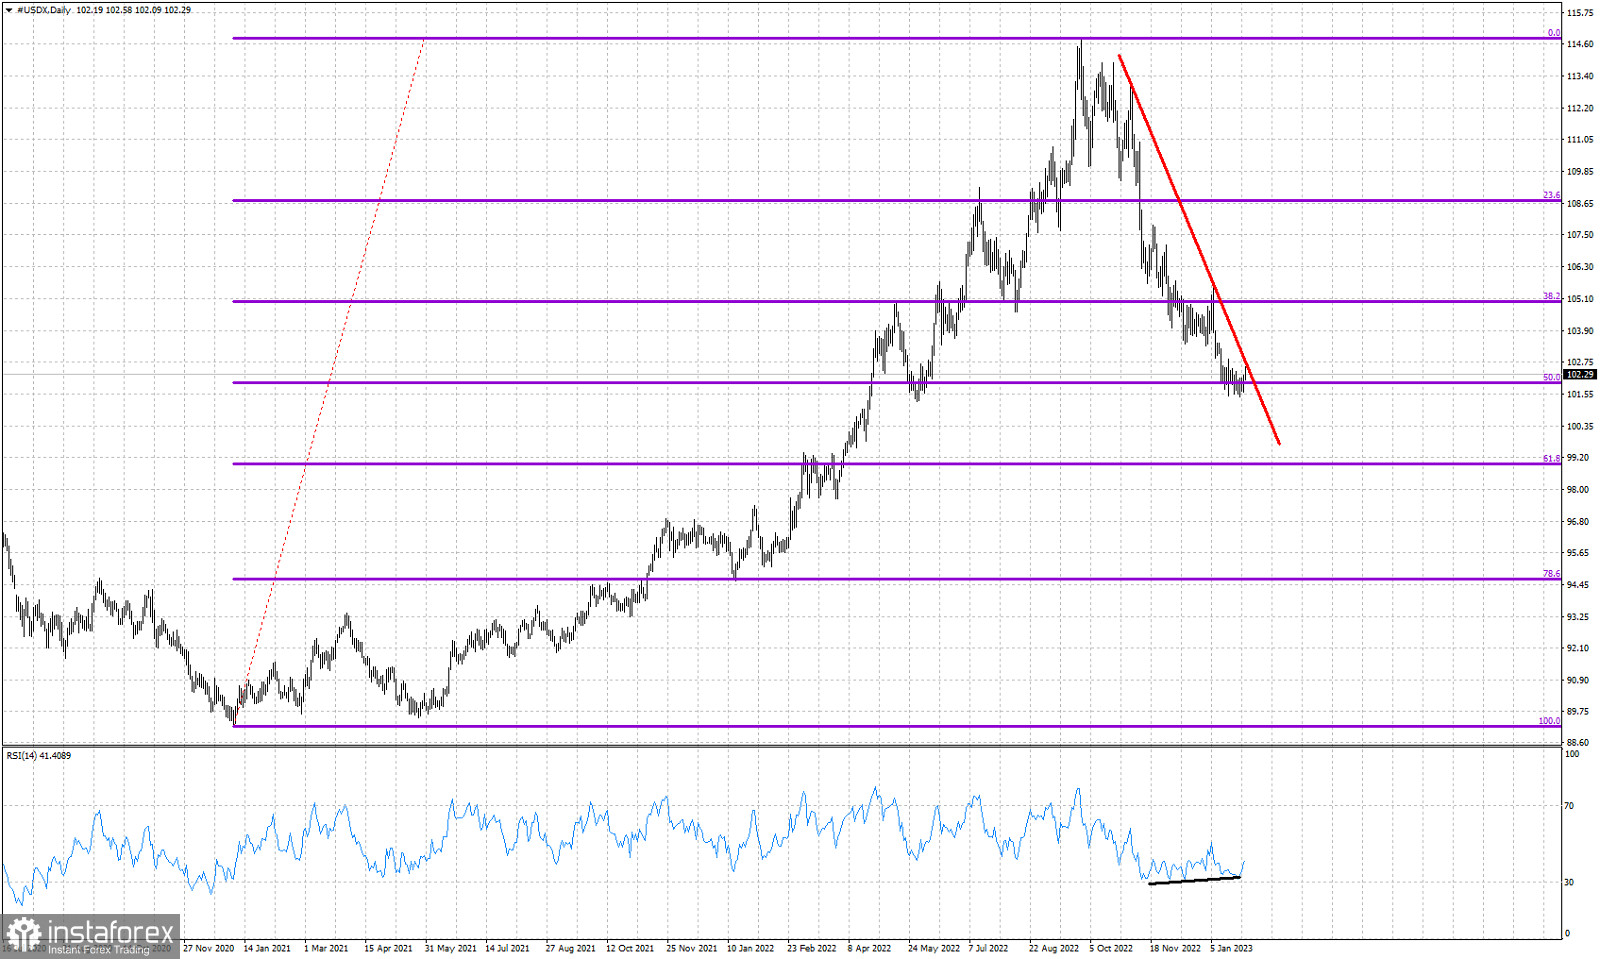
Red line- resistance
Black line- Bullish RSI divergence
Violet lines- Fibonacci retracement levels
The Dollar index is trading around 102.25 after making a low around 101.47 4 sessions ago. Price has stopped the decline at the 50% Fibonacci retracement level. In previous posts we noted that the Fibonacci support level combined with the bullish RSI divergence increases the chances of a reversal. Technically trend remains bearish as price has not started making higher highs and higher lows. Price remains below the key downward sloping resistance trend line. Resistance by the trend line is at 102.80. Bulls need to break above this level in order to hope for a bigger bounce. The RSI is turning upwards from oversold levels. There are increased chances that the Dollar index makes an important low around these levels.


