


Yesterday, GBP/USD continued its upward correction amid the lack of any macroeconomic background. However, today, the data on the UK labor market has already been published and it came in better than expected. Thus, unemployment in the UK fell to 3.7% versus the forecast of 3.8%. The number of jobless claims also dropped below the projected value of -42.5 and amounted to -56.9. Naturally, the jobs report from the UK could not stay unnoticed. At the moment of writing, the pound was notably rising supported by this upbeat employment data. Later in the day, the reports on retail sales and industrial production will be released in the US. Traders will pay attention to Fed Chair Jerome Powell who will make a statement in the evening.
Daily chart
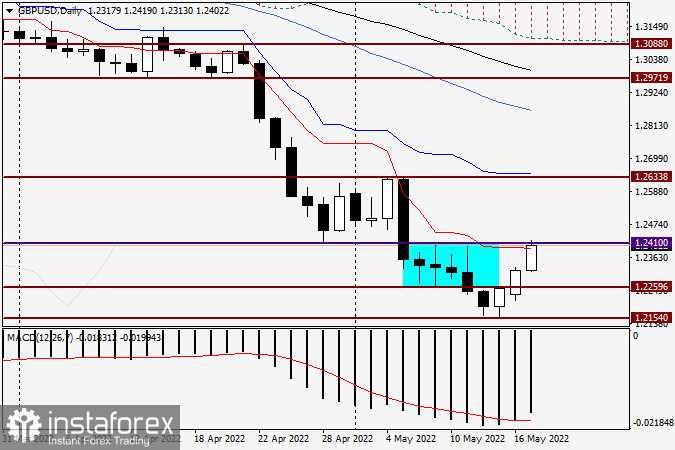
On the daily chart, we can see the scenario that I mentioned yesterday. While following the uptrend, the pair pulled back to the broken support level of 1.2410. Notably, the red Tenkan line of the Ichimoku Indicator lies just below this mark. I believe that both the level of 1.2410 and the Tenkan line can serve as resistance for the price. If the pair closes the session above 1.2410, the uptrend is likely to continue to the psychological and technical level of 1.2500. If a reversal candlestick pattern appears near 1.2410 and the price closes below this level, the upside correction can be deemed completed and we can expect the resumption of the downward movement. Personally, I think that the long-awaited correction in the British pound will continue, especially since there are fundamental reasons for this. Nevertheless, do not forget that the GBP/USD is still trading within the downtrend. So, this assumption should be taken as a personal opinion of the author.
H4
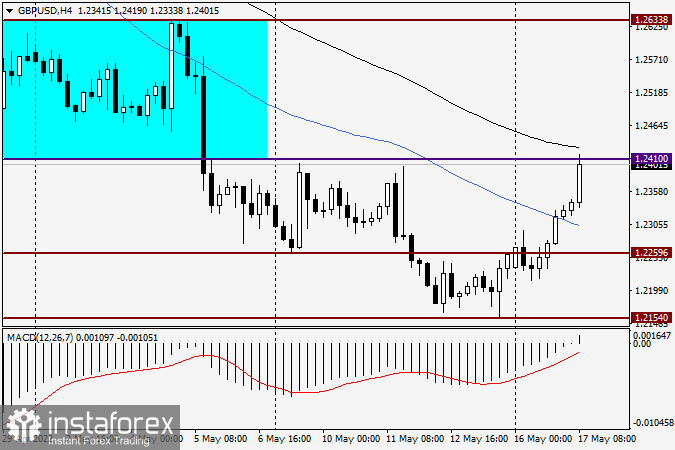
On the four-hour chart, the pound has returned above the previously broken support level, which is why this breakout was a false one. Moreover, on its way up, the pair overcame the blue 50-day simple moving average and has already consolidated above it. Now the next barrier for the bulls is the black 89-period exponential moving average, which is located slightly above the mark of 1.2410. I propose the following trading plan. If the price breaks above the level of 1.2410 and the 89-EMA and settles firmly there on a pullback to the price area of 1.2435-1.2410, then it is a good time to open long positions. If there will be no breakout of the indicated level and the moving average and the bearish candlestick pattern appears instead, this will be a signal to sell the pair. That's all for now. Remember that the pound loves deep corrective pullbacks which sometimes lead to a change in the trend.
Good luck!


