


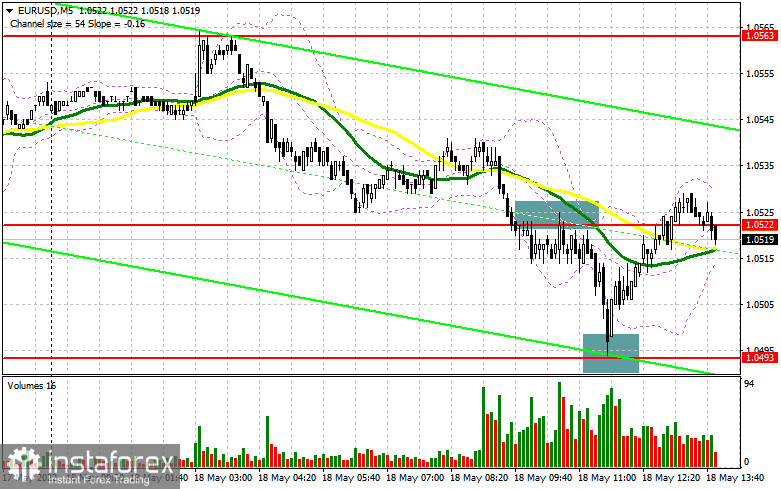
In the morning article, I highlighted the levels of 1.0522 and 1.0493 and recommended taking decisions with this level in focus. Now let's look at the 5-minute chart and try to figure out what actually happened. Inflation in the eurozone slowed down in April. As a result, demand for the euro declined, pushing the euro/dollar pair lower. A breakout and an upward test of 1.0522 gave an excellent sell signal. The pair decreased by about 30 pips, reaching the support level of 1.0493. A bull signal appeared after a false breakout of this level. The pair added 30 pips thanks to an upward reversal to 1.0522.
What is needed to open long positions on EUR/USD
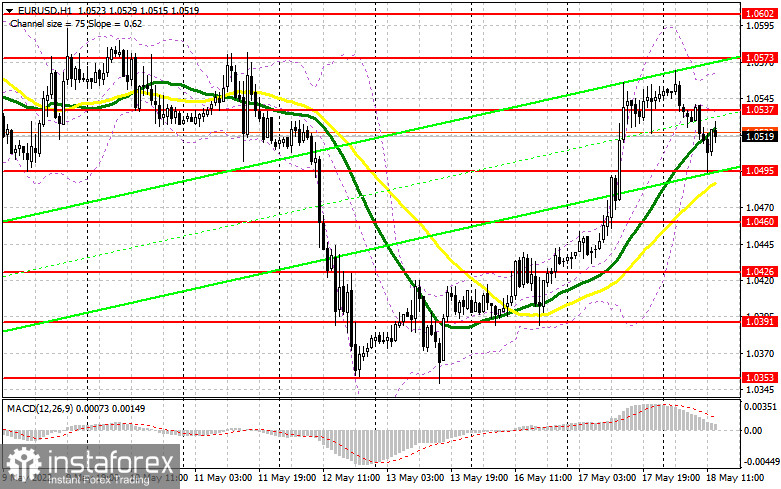
In the afternoon, the technical outlook changed. Given that the economic calendar for the US is empty, the euro/dollar pair is likely to be trading within the sideways channel of 1.0495-1.0537. Bulls may try to renew an upward correction, turning into an upward trend. The building permits and housing starts reports are unlikely to boost the US dollar. For this reason, bulls may easily push the euro to 1.0537. If the pair declines after the US data, only a false breakout of 1.0495 will give a good entry point into long positions within the upward correction. As I have noted, bulls will try to regain ground and push the pair above 1.0537, an important level formed in the morning. Consolidation above 1.0537 may occur if FOMC member Patrick T. Harker makes rather pessimistic comments. A breakout and a downward test of 1.0537 will give a new buy signal. If so, the bullish sentiment will strengthen. It will also open the way to 1.0573 where I recommend locking in profits. A more distant target will be the 1.0602 level. However, the pair needs more drivers to approach this level. If the pair slides down and bulls show no activity at 1.0495, the pressure on the euro is likely to increase. In this case, it is better to open long positions after a false breakout near the low of 1.0460. However, I would advise you to buy the euro at this level only after a false breakout. It is possible to open long positions immediately at a bounce from 1.0426 or even a lower low around 1.0391, keeping in mind an upward intraday correction of 30-35 pips.
What is needed to open short positions on EUR/USD
Bears have regained control, pushing the pair to the needed levels in the first half of the day. Now, they should maintain momentum. They will be able to cement a downward movement if they push the price to the nearest resistance level of 1.0537. The pair is now heading for this level. The return of the price to the support level 1.0495 is quite an important task. A breakout and an upward test of 1.0495 after the release of US data and FOMC policymaker's speech, will generate an additional sell signal. If so, the pair is likely to approach the lows around 1.0460 and 1.0426 where I recommend locking in profits. If Patrick T. Harker hints at more aggressive tightening, which is unlikely, the price is sure to drop to 1.0391. However, this is a distant target. Should EUR/USD grow after the publication of the US reports, it is better to open short positions after a false breakout of the resistance level of 1.0537. If bears show no energy at this level, a sharp upward reversal may take place. If this scenario comes true, I would advise you to sell the euro after a false breakout of 1.0573. You can sell EUR/USD immediately at a bounce from 1.0602, keeping in mind a downward intraday correction of 30-35 pips.
COT report
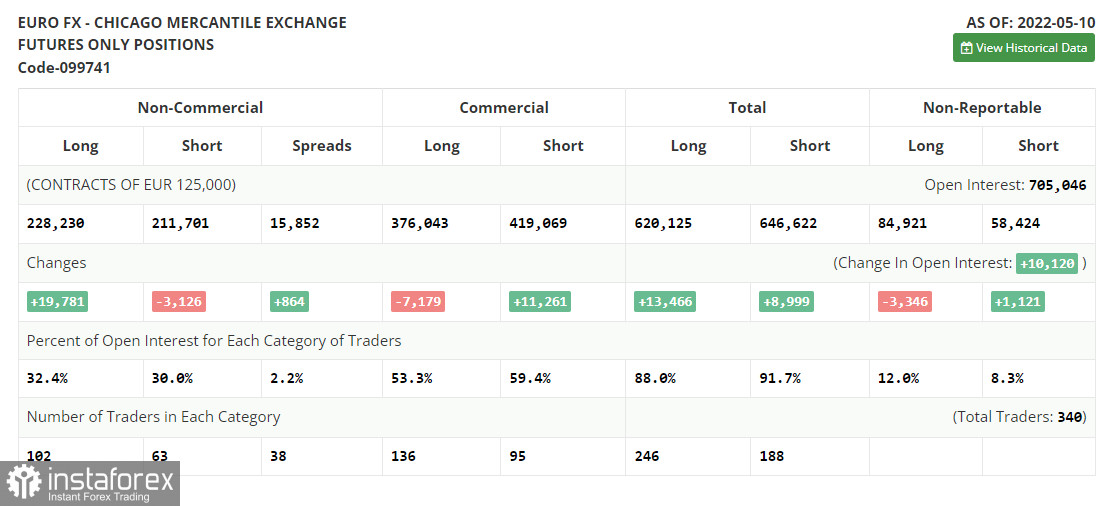
The COT report (Commitment of Traders) for May 10 logged a sharp increase in long positions and a drop in short ones. The euro's oversold status indicates interest from traders and investors. ECB policymakers' recent statements fueled optimism that the euro may be able to start an upward cycle. The ECB is widely expected to raise the key rate by a quarter-point in July this year, then in September and in December, bringing it to 0.25% by the end of the year. The next rate hikes will follow in September and in December from the current zero level to 0.5%. Such an aggressive tightening will help euro bulls to find the bottom in the near future. However, the US Fed alongside escalating geopolitical tensions might derail such plans. The US regulator sticks to aggressive monetary policy tightening. Some analysts believe that at the next meeting the central bank may raise the key rate by 0.75%. This scenario gives a clear signal to buy the US dollar in the medium term. The COT report revealed that long non-commercial positions jumped by 19,781 from 208,449 to 228,230, while short mom-commercial positions dropped by 3,126 from 214,827 to 211,701. As I have already noted, the low rate of the euro makes it more attractive for traders. Currently, we see that more buyers are entering the market. At the end of the week, the total non-commercial net position increased to 16,529 against a negative indicator of -6,378 a week earlier. The weekly closing price remained practically unchanged at 1.0546 versus 1.0545.
Signals of technical indicators
Moving averages
EUR/USD is trading near 30- and 50-period moving averages. It means that the bulls don't give up attempts to carry on with an upward correction.
Remark. The author is analyzing the period and prices of moving averages on the 1-hour chart. So, it differs from the common definition of classic daily moving averages on the daily chart.
Bollinger Bands
In case of a decline, the lower border at around 1.0500 will act as support.
Definitions of technical indicators
- Moving average recognizes an ongoing trend through leveling out volatility and market noise. A 50-period moving average is plotted
- yellow on the chart.
- Moving average identifies an ongoing trend through leveling out volatility and market noise. A 30-period moving average is
- displayed as the green line.
- MACD indicator represents a relationship between two moving averages that is a ratio of Moving Average Convergence/Divergence. The MACD is calculated by subtracting the 26-period Exponential Moving Average (EMA) from the 12-period EMA. A 9-day EMA of the MACD called the "signal line".
- Bollinger Bands is a momentum indicator. The upper and lower bands are typically 2 standard deviations +/- from a 20-day simple moving
- average.
- Non-commercial traders - speculators such as retail traders, hedge funds, and large institutions who use the futures market for speculative purposes and meet certain requirements.
- Non-commercial long positions represent the total long open position of non-commercial traders.
- Non-commercial short positions represent the total short open position of non-commercial traders.
- The overall non-commercial net position balance is the difference between short and long positions of non-commercial traders.


