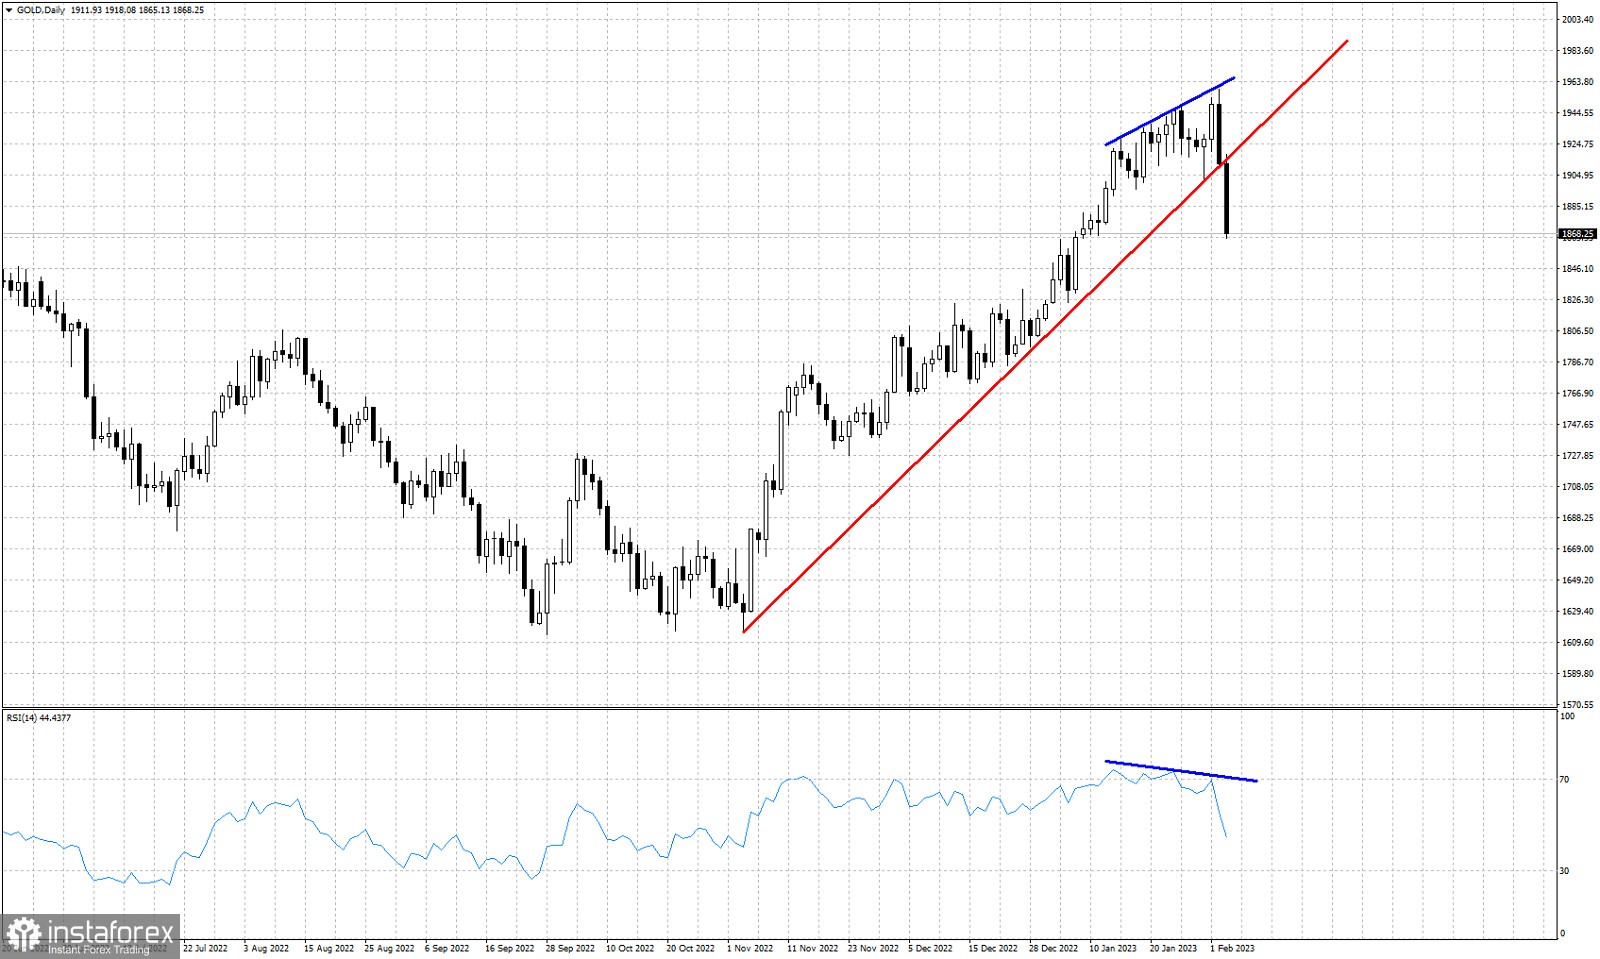
Red line - support trend line
Blue line- bearish RSI divergence
Gold price is trading around $1,865. Price has lost in two days what it gained in several weeks. Gold price is trading below January 9 levels. The warning signs were there and we posted them before the reversal. All key short-term support levels we noted broke one by one providing key selling signals. The RSI was warning us even when price was testing $1,970 by making another lower high suggesting weakening up trend. Today price also broke below the upward sloping support trend line. Today's price action suggests that the entire upward move from $1,616 is complete. I expect Gold price to at least make a retracement relative to that upward movement. At $1,827 we find the first key Fibonacci retracement level of 38%. Gold is expected to test this level.


