


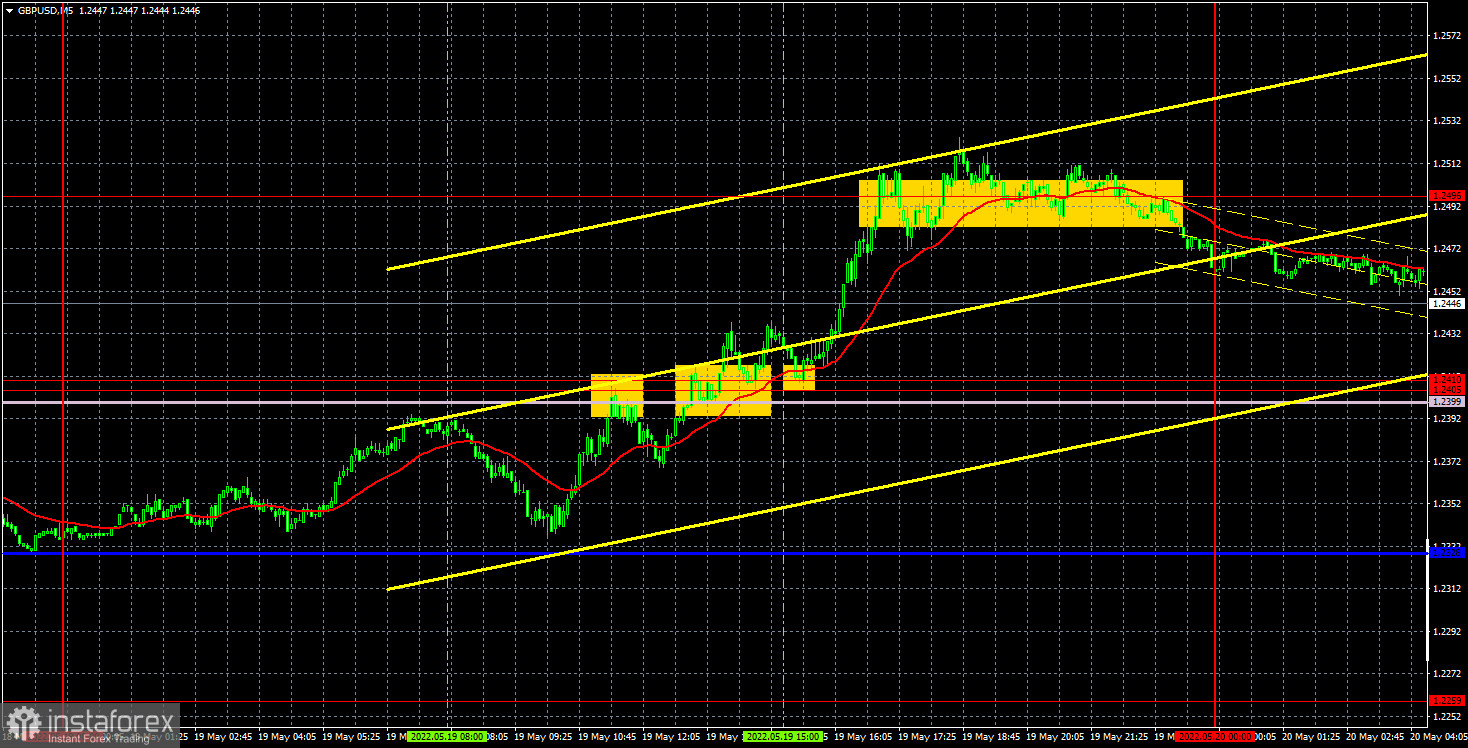
GBP/USD 5M
Yesterday, the GBP/USD currency pair repeated the fate of the euro/dollar and showed a fairly strong growth. Most likely, the reasons for the sharp strengthening of the British currency are the same - technical, since there weren't any important macroeconomic statistics yesterday. Thus, we can assume that both pairs are now just correcting. Therefore, the main question is how far up they can go? From our point of view, the correction can end at almost any moment. If you look at the higher timeframes, you can clearly see that even the current strong rise in the euro and the pound is actually weak compared to the previous fall. Moreover, given the fact that traders were reluctant to buy both the euro and the pound, we can assume that there are still few bulls in the market. After all, growth could have been achieved by reducing short positions! If so, then the euro could fall at any moment if the bears again begin to actively sell the euro and the pound.
There were several trading signals during the past day. All - far from the most accurate and strong. First, the pair bounced off the Senkou Span B line and managed to go down after that by only 21 points, which was enough to put Stop Loss at breakeven. Then a buy signal formed when the area 1.2405-1.2410 was overcome. After that, the pair went up more than 70 points and initially rebounded from the level of 1.2496. Therefore, longs should have been closed (profit about 50 points) and shorts should have been opened. However, after that, the price began to move almost in a flat, so the sell signal did not bring profit, only a loss. All subsequent signals were to be ignored. As a result, there was no loss at the end of the day, but it was hardly possible to earn a lot.
COT report:
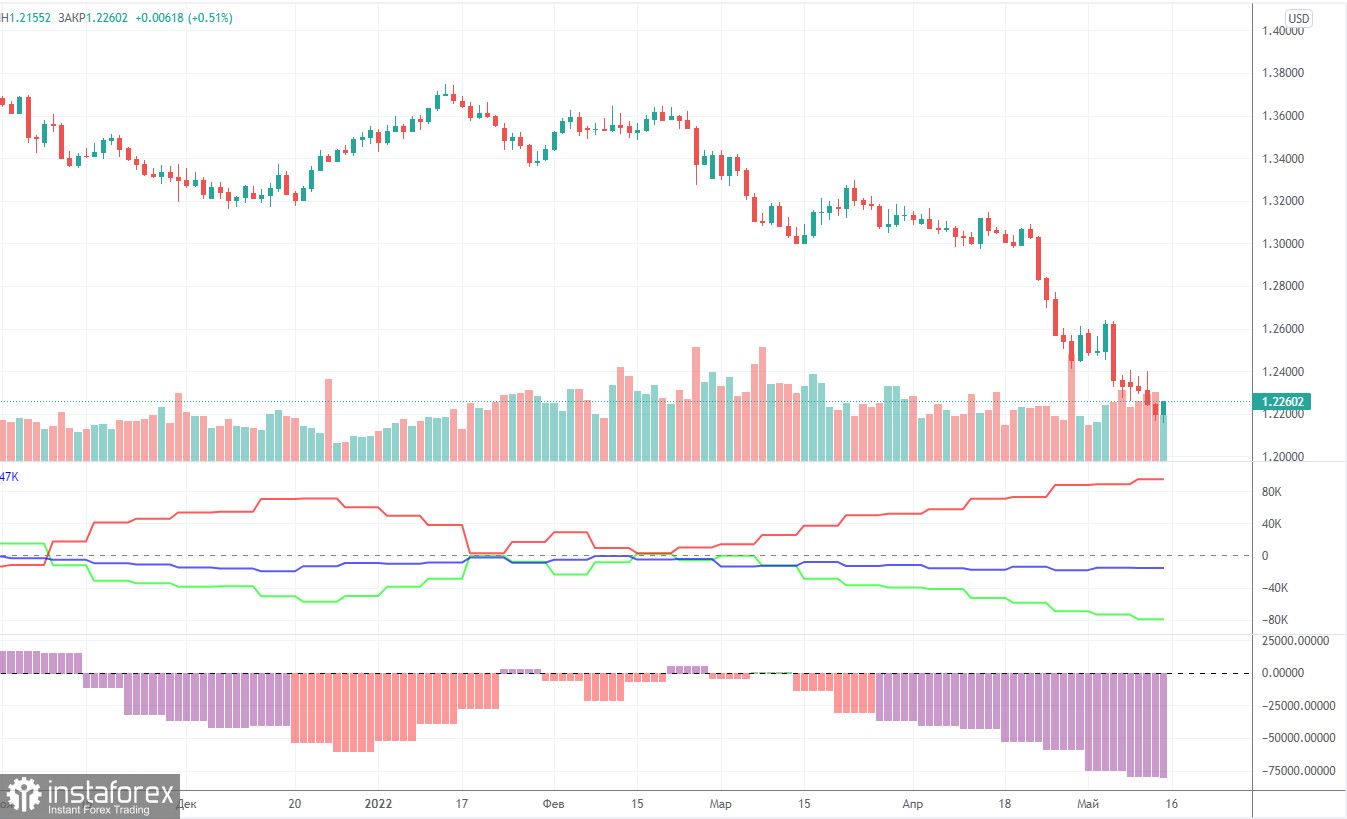
The latest Commitment of Traders (COT) report on the British pound has witnessed a new increase in bearish sentiment among commercial traders. During the week, the non-commercial group closed 4,000 long positions and opened 1,700 short positions. Thus, the net position of non-commercial traders decreased by another 5,700. The net position has been falling for three months already, which is perfectly visualized by the green line of the first indicator in the chart above. Or the histogram of the second indicator. The non-commercial group has already opened a total of 109,000 shorts and only 29,000 longs. Thus, the difference between these numbers is already fourfold. This means that the mood among professional traders is now "pronounced bearish" and this is another factor that speaks in favor of the continuation of the fall of the British currency. Note that in the case of the pound, the data from the COT reports very accurately reflects what is happening in the market. Traders are "significantly bearish" and the pound has been falling against the US dollar for a very long time. We do not yet see concrete signals for the end of the downward trend, however, usually a strong divergence of the red and green lines of the first indicator signals the imminent end of the trend and the beginning of another. Therefore, the conclusion is that an upward trend may begin in the near future, but it is dangerous to try to catch its beginning at the lowest point. The pound may well fall another 200-400 points.
We recommend to familiarize yourself with:
Overview of the EUR/USD pair. May 20. The European Union is switching to solar energy, and Hungary continues to block the sixth package of sanctions.
Overview of the GBP/USD pair. May 20. Great Britain and the European Union remembered that they also have their own reason for the conflict.
Forecast and trading signals for GBP/USD on May 20. Detailed analysis of the movement of the pair and trading transactions.
GBP/USD 1H
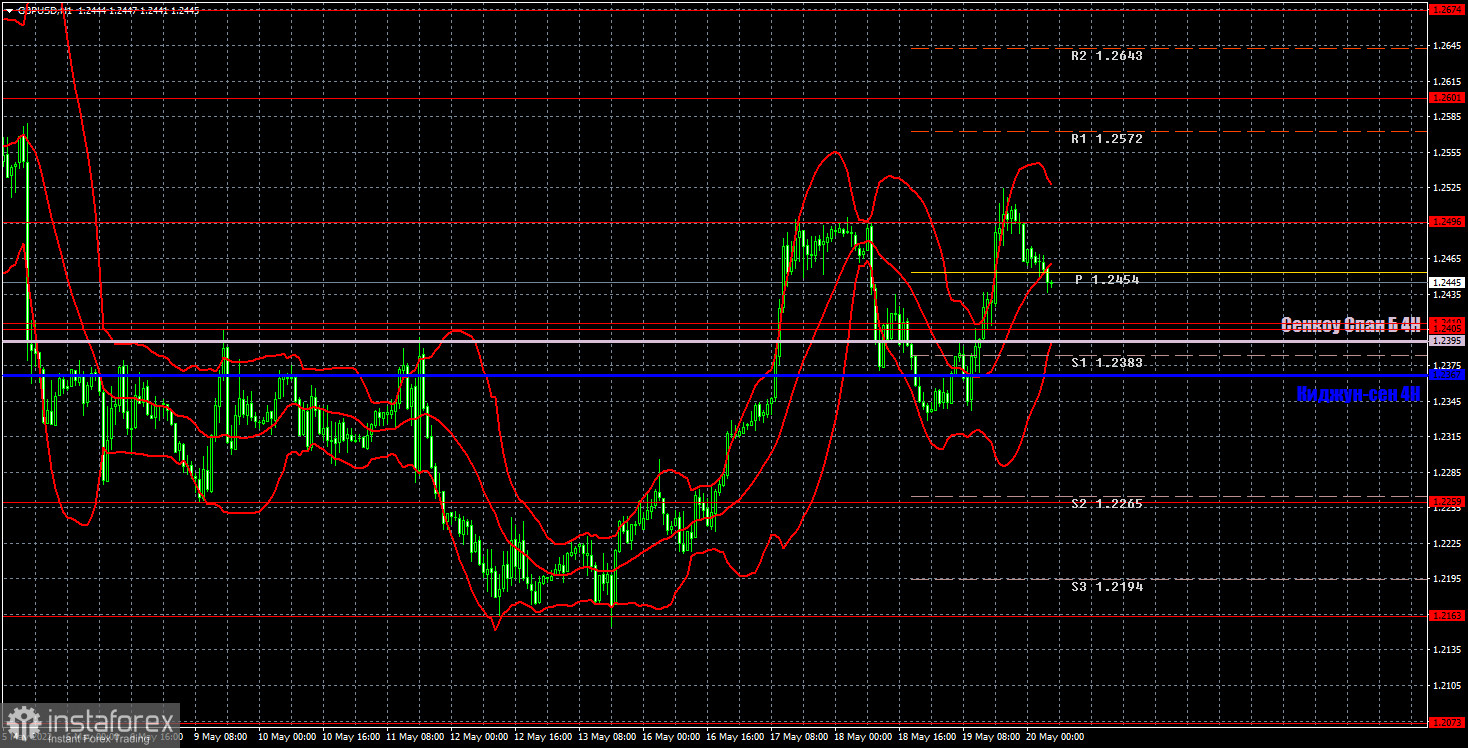
It is clearly seen on the hourly timeframe that the pair rose to the level of 1.2496 for the second time. The total growth from the last low is already 350 points, and at the same time (!!!) the pair has not even reached its last local high (near the level of 1.2601). That is, at the moment, globally, the downward trend continues. Therefore, on the hourly timeframe, the pair needs to continue rising at least another 150 points just to show that a new upward trend is possible. Otherwise, the pound could very quickly return to updating its two-year lows. For May 20, we highlight the following important levels: 1.2163, 1.2259, 1.2405-1.2410, 1.2496, 1.2601, 1.2674. The Senkou Span B (1.2395) and Kijun-sen (1.2367) lines can also be sources of signals. Signals can be "rebounds" and "breakthrough" of these levels and lines. The Stop Loss level is recommended to be set to breakeven when the price passes in the right direction by 20 points. Ichimoku indicator lines can move during the day, which should be taken into account when determining trading signals. The chart also contains support and resistance levels that can be used to take profits on trades. The retail sales report will be released today in the UK, which may affect the pair's movement. There is nothing interesting in the US today.
Explanations for the chart:
Support and Resistance Levels are the levels that serve as targets when buying or selling the pair. You can place Take Profit near these levels.
Kijun-sen and Senkou Span B lines are lines of the Ichimoku indicator transferred to the hourly timeframe from the 4-hour one.
Support and resistance areas are areas from which the price has repeatedly rebounded off.
Yellow lines are trend lines, trend channels and any other technical patterns.
Indicator 1 on the COT charts is the size of the net position of each category of traders.
Indicator 2 on the COT charts is the size of the net position for the non-commercial group.


