Details of the economic calendar from May 19
Weekly jobless claims in the United States reflected a decline in the overall volume.
Statistics details:
The volume of continuing claims for benefits decreased from 1.342 million to 1.317 million.
The volume of initial claims for benefits increased from 197,000 to 218,000.
Analysis of trading charts from May 19
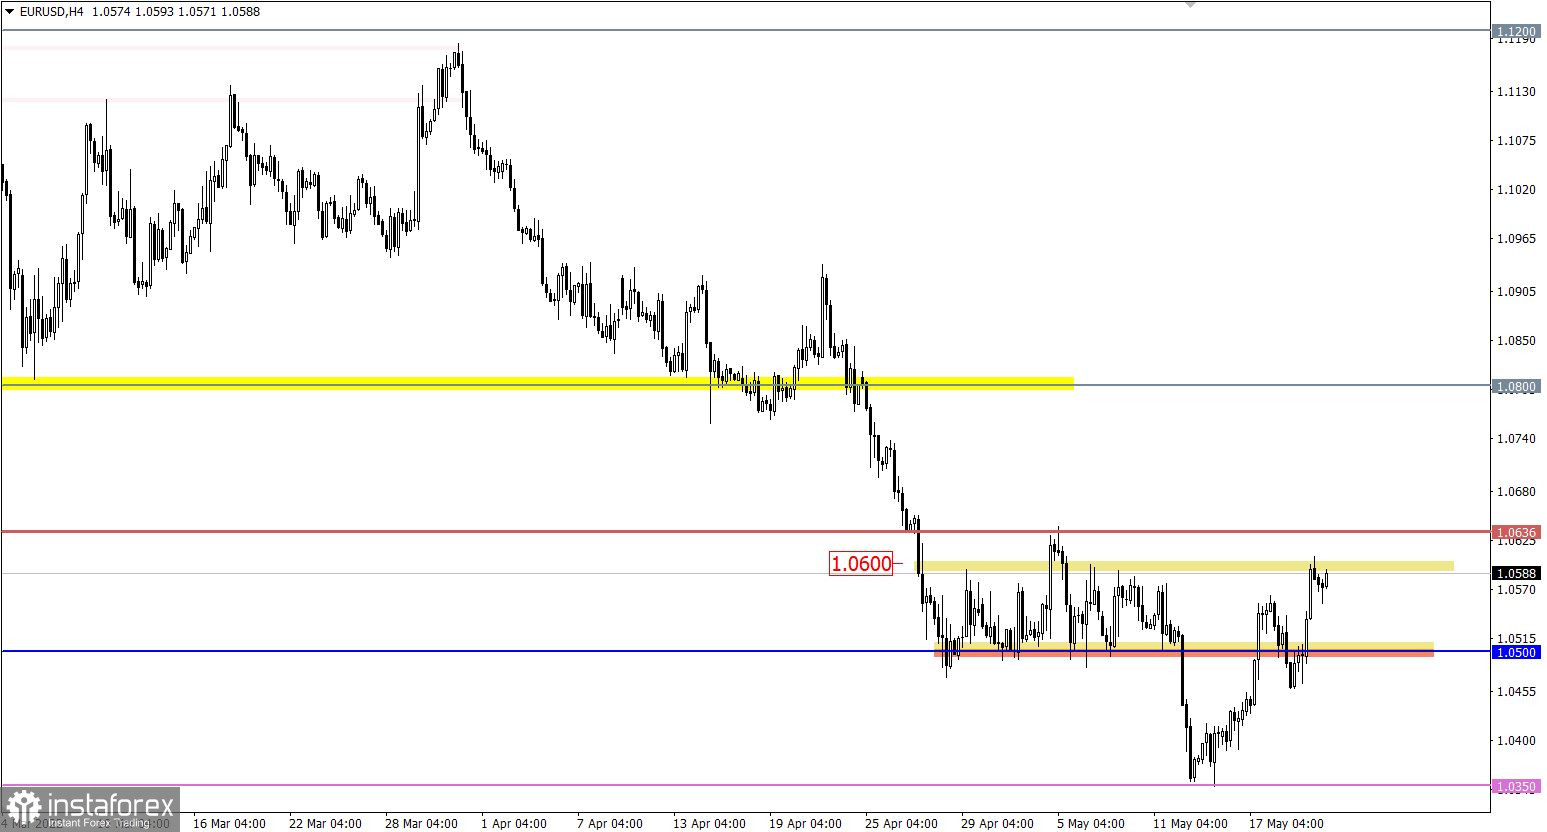
The EURUSD currency pair, after a short stop around 1.0500, resumed the construction of a corrective move. This movement returned the quote to the upper limit of the previously broken flat 1.0500/1.0600.
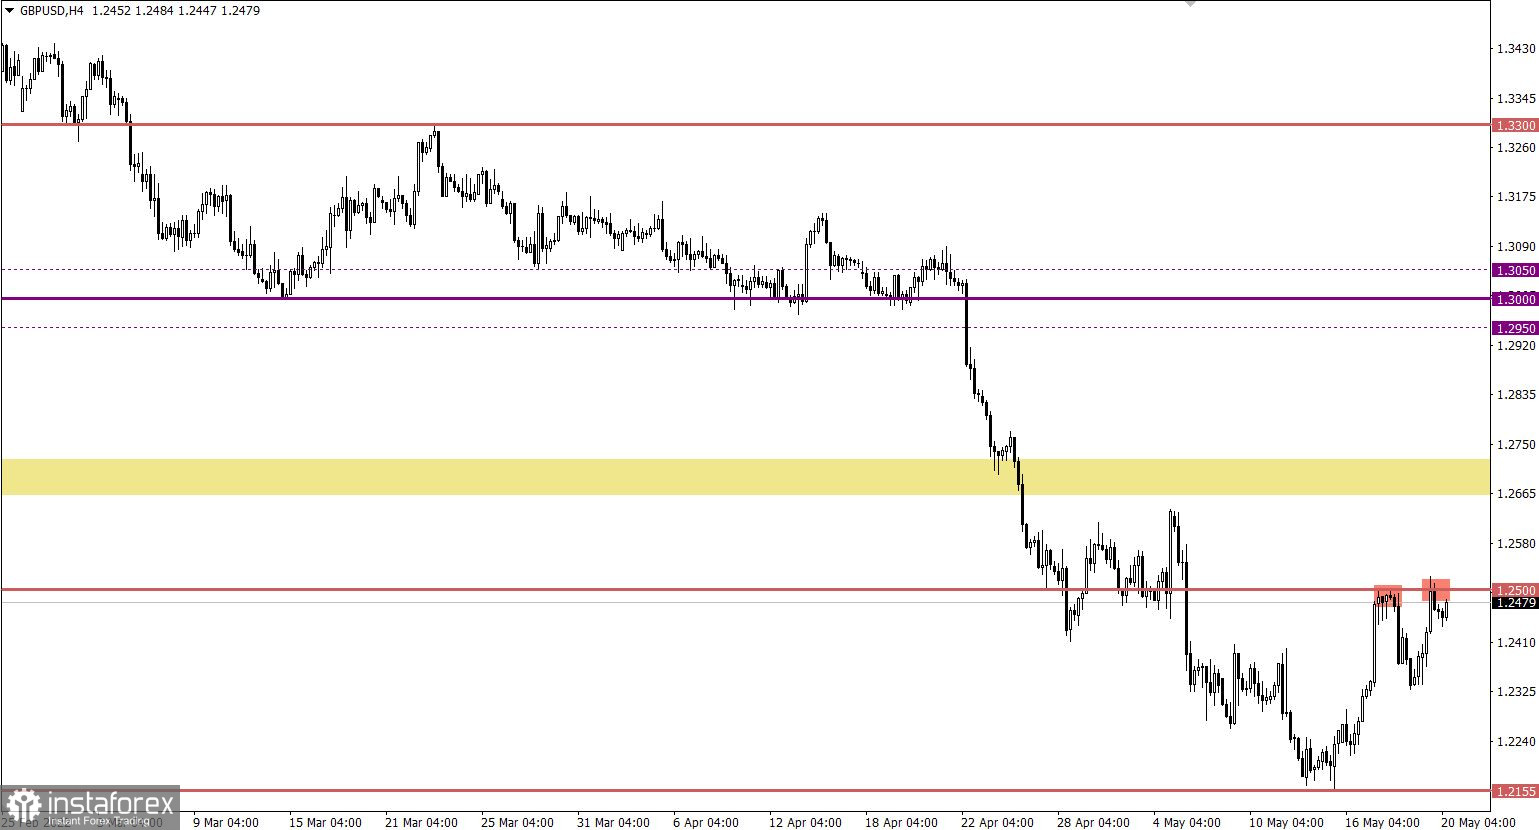
The GBPUSD currency pair has not managed to stay below 1.2300. Instead of speeding up the process of restoring dollar positions, the quote returned to the tact of correction, returning us to the resistance level of 1.2500.

Economic calendar for May 20
UK retail sales dropped by 4.9% YoY in April replacing 1.3% growth in March. Analysts assumed a decline of 7.2%. The discrepancy in the forecasts delayed the rapid weakening of the pound sterling.
Trading plan for EUR/USD on May 20
In this situation, a price rebound from the border of 1.0600 is possible, which will lead to a reverse move towards the level of 1.0500. This movement can form a flat.
An elongated correction scenario will be considered by traders if the price holds above 1.0636 in a four-hour period.

Trading plan for GBP/USD on May 20
The subsequent increase in the volume of short positions is expected at the time of holding the price below the value of 1.2300 in a four-hour period. This move may lead to further weakening of the pound towards the May 13 local bottom at 1.2155.
An alternative scenario will be considered by traders if the price returns to the resistance level. So the correction will have a second chance for a prolongation.

What is reflected in the trading charts?
A candlestick chart view is graphical rectangles of white and black light, with sticks on top and bottom. When analyzing each candle in detail, you will see its characteristics of a relative period: the opening price, closing price, and maximum and minimum prices.
Horizontal levels are price coordinates, relative to which a stop or a price reversal may occur. These levels are called support and resistance in the market.
Circles and rectangles are highlighted examples where the price of the story unfolded. This color selection indicates horizontal lines that may put pressure on the quote in the future.
The up/down arrows are the reference points of the possible price direction in the future.


