Bitcoin is having one of the toughest months in its history thanks to a number of fundamental factors. There is every reason to believe that the asset has experienced the most severe and negative trials in less than a month in May. At the same time, we saw that the market managed to defend the bullish positions with difficulty, due to which the price reached the $29k–$30k range. At the moment, the main concern is that all the factors and conditions of the Bitcoin downward trend remain. But at the same time, the asset operates according to the proven pattern of "rebound from a deep bottom and subsequent consolidation."
Could this indicate that the cryptocurrency has completed its decline as part of the current negative factors on the market? There is no definite answer to this question, but there is also no doubt that there are a number of signals that historically or technically hinted at a recovery in Bitcoin quotes.
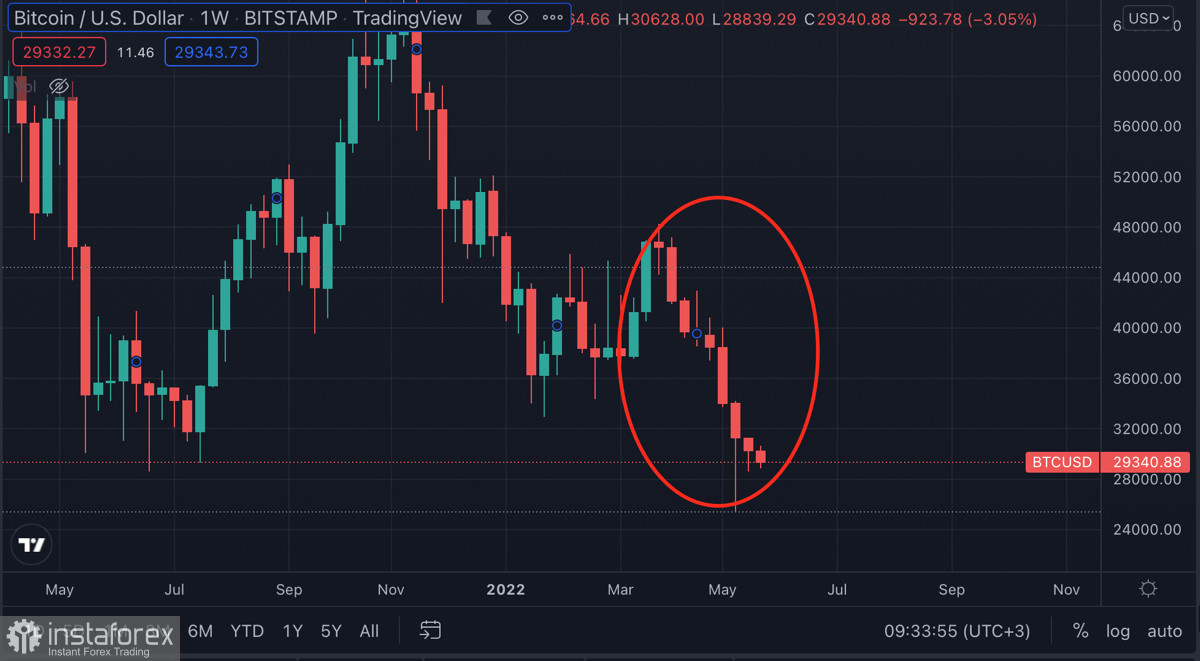
The first and most important is the formation of eight red candles in a row, which is a historic achievement and once again indicates a strong bearish trend in the market. If we analyze these candles in terms of volumes provided by sellers, we can see that their potential has dried up. The body of the last bearish candle indicates that the strength of sellers is ending, and it is likely that the current week will be a turning point.
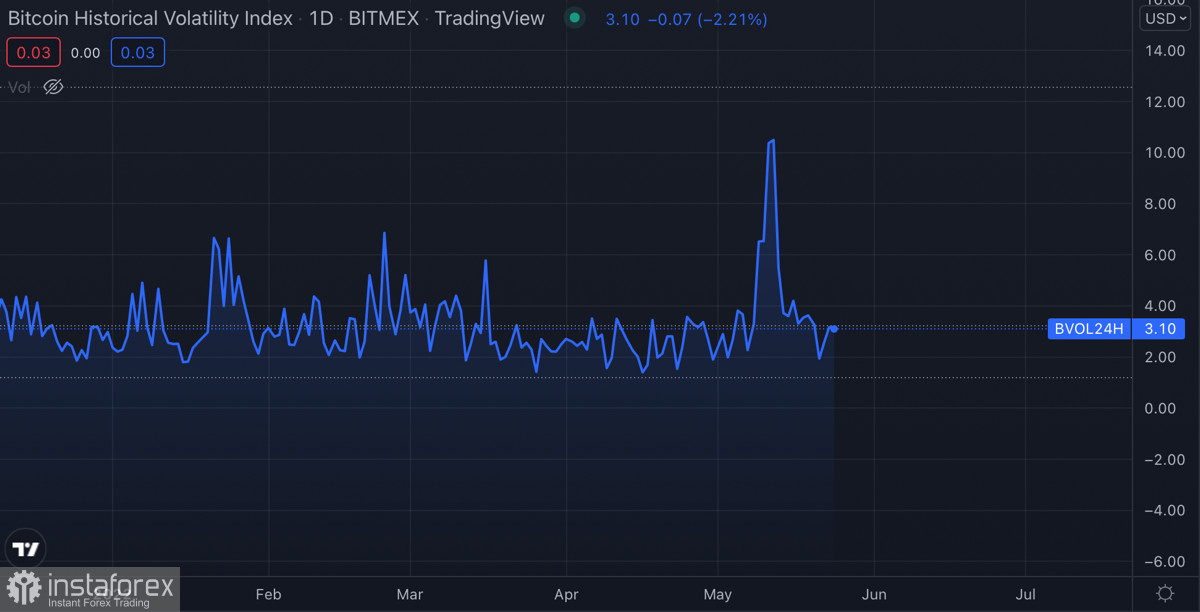
Another important fundamental factor with a historical context is the fear and greed index. The decline of this indicator to the minimum indicators has always been a harbinger of the establishment of a local bottom and the subsequent thaw period in the market. The current situation is not developing according to a template scenario due to a sharp jump in volatility, as well as the situation around the UST stablecoin. Despite this, as of April 24, volatility is falling, the fear and greed index has risen to 12, and BTC/USD quotes have begun to consolidate. This indicates a stabilization of the situation, a decrease in the level of fear and a possible increase in buying activity.
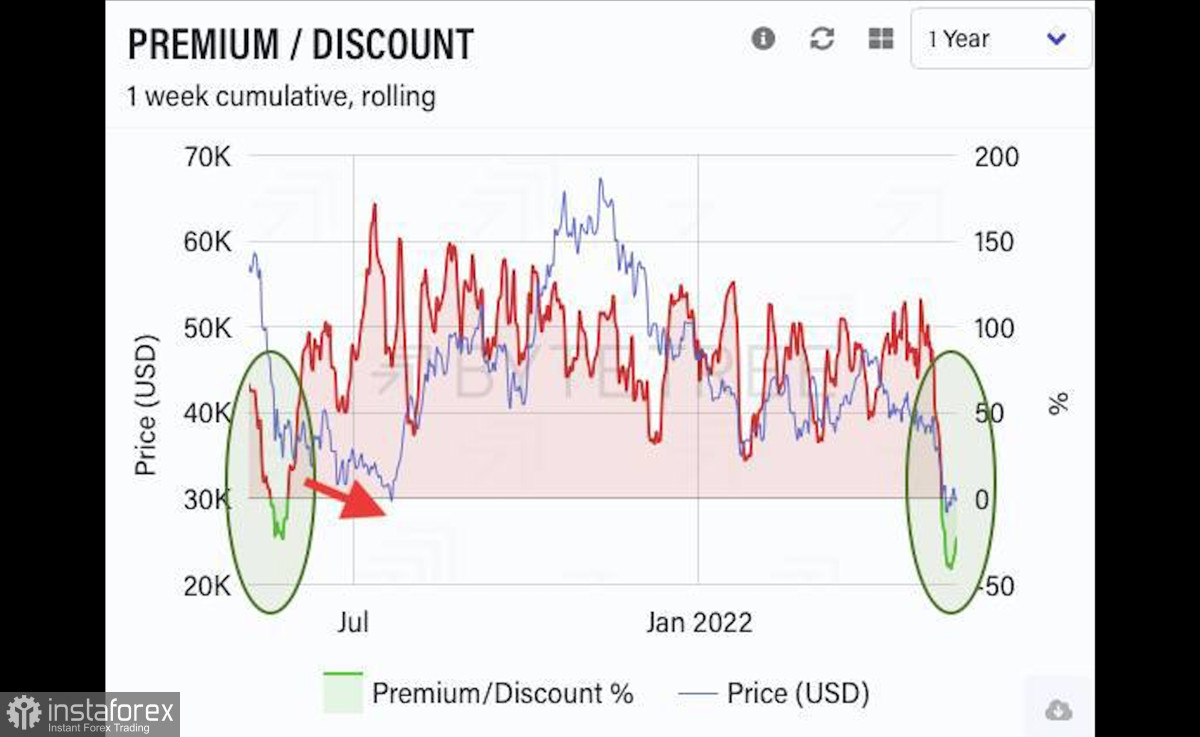
Now let's move on to more technical characteristics of BTC price movement. It is trading below fair value for the first time since June 2021. This speaks to the extreme level of fear of investors who are moving capital into assets backed by the Fed. In the current economic and market situation, this is the US dollar. This behavior should rather be regarded as temporary, since the market has no idea about the fate of many assets, including Bitcoin. In addition, Bitcoin historically falls below the fair value mark for a short period of time, and therefore this can also be regarded as a bullish signal.
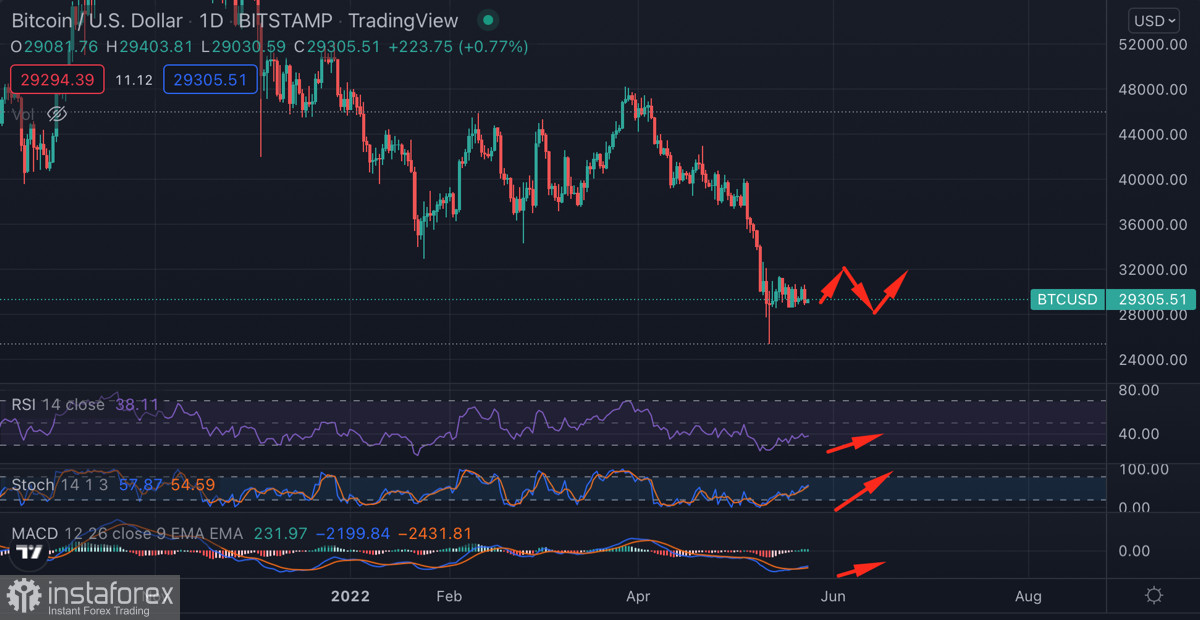
As of May 24, BTC/USD is trading around the 0.236 Fibonacci level. The nature of the current rebound of cryptocurrency quotes stands out from the rest. In most cases, after a rebound with the formation of a long lower shadow, there was a sharp impulsive upward spurt, or a gradual but obvious price decline. We are now seeing a classic period of consolidation with low trading volumes and falling volatility.
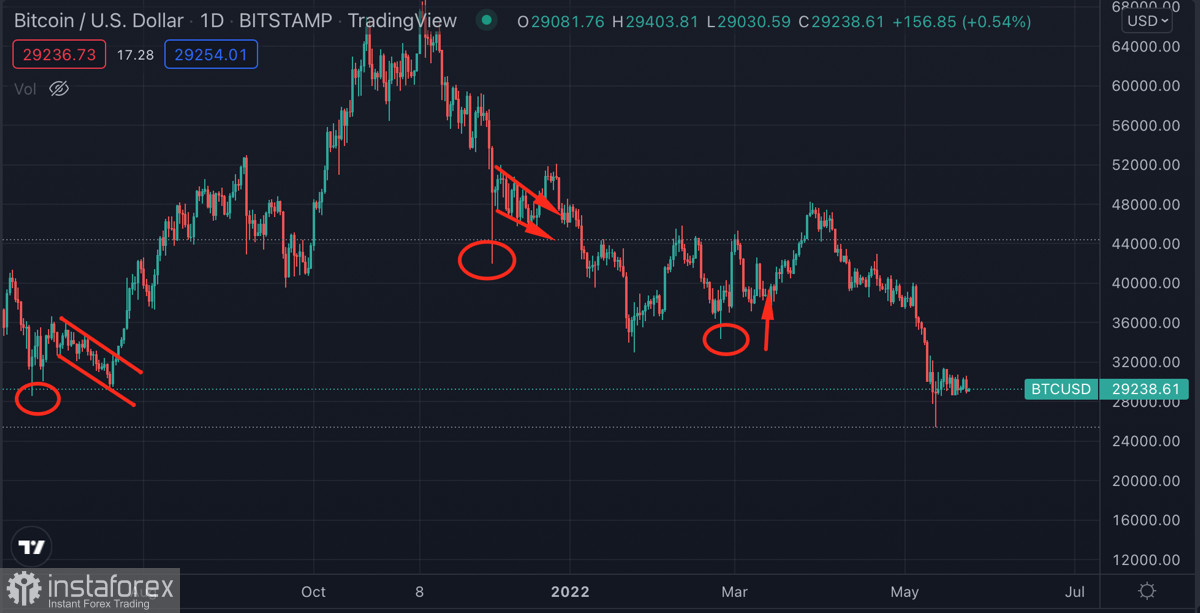
The price is holding above the key Fibo level of 0.236, while technical indicators are signaling the continuation of consolidation and an attempt to break out of the $29k–$30k range. The volume of purchases is growing, judging by the rising mood of the RSI and stochastics. The MACD indicator also continues its upward movement, but is still below the zero mark. So far, there are no prerequisites for a decrease or increase in the price of cryptocurrency on the Bitcoin charts. The asset is quietly plowing through the narrow spaces of the $29k–$30k corridor, moving from the lower border to the upper one. Right now, there is no reason to believe that until the end of May, the cryptocurrency will continue to move within the specified range without sharp price fluctuations.