


Hello, dear traders!
Yesterday, GBP/USD showed growth and broke through resistance at 1.2523. We will get back to the technical picture in a while. Now, let's discuss yesterday's speech of BoE Governor Andrew Bailey. He asserted the central bank is ready to continue hiking rates further in order to tame inflation. Previously, the sterling used to skyrocket whenever such announcements came. However, not this time. Indeed, the current sentiment in the market is completely different. Moreover, the market is no longer the same anymore. In his speech, Mr. Bailey focused on the negative impact of higher import prices on the incomes of British households.
In addition, the BoE's head confuted the argument that the pandemic-related actions of the UK Cabinet and the regulator's stance on monetary policy affected demand and boosted inflation. The central bank of any advanced economy must maintain and regulate price stability. Yet, when the situation required the Bank of England to act, it did nothing. In general, market participants used to ignore statements made by the governor, which shows their attitude towards this high-rank policymaker.
Today, the focus is on such macro events as the services PMI in the UK and business activity in the US. Chairman Powell's speech will be at the center of attention as well.
Daily
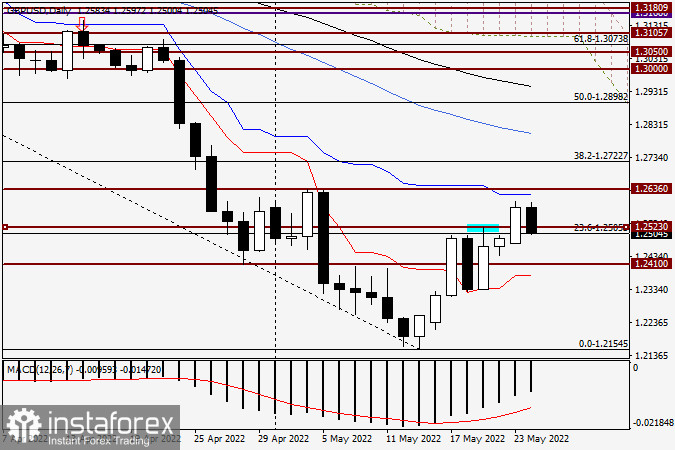
The pair broke through resistance at 1.2523 and the important psychological level of 1.2500 yesterday. The day closed at 1.2583. Today, the quote has already pulled back to the broken resistance level and then retraced up. The daily candlestick has acquired the lower shadow. If bulls are strong enough to extend the rally, the target is seen in the range of 1.2600-1.2636, in line with the blue Kijun line. If the pair reaches this zone, it may then encounter strong resistance and reverse down. Therefore, those willing to sell the pair today should focus on this range.
H4
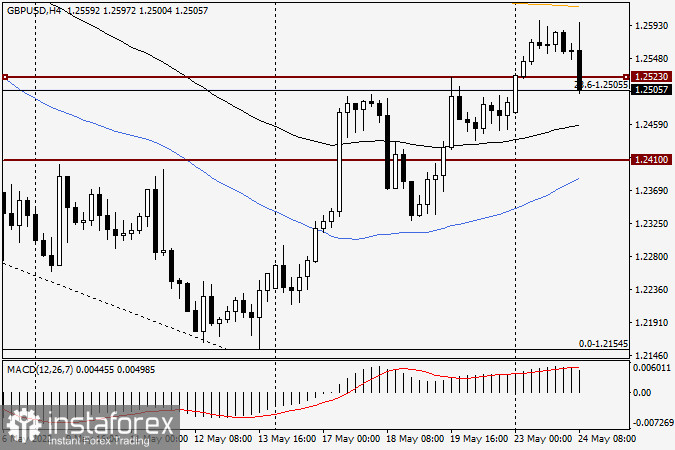
On the H4 chart, there is the orange EMA 200 below the resistance level of 1.2636. Should a bearish candlestick pattern emerge below them, it would make a sell signal. Against such a backdrop, buying should be put on hold. Long positions could be considered when a true breakout of the orange EMA 200 and the resistance level of 1.2636 occurs and the quote then pulls back to the broken price levels.
Have a nice trading day!


