


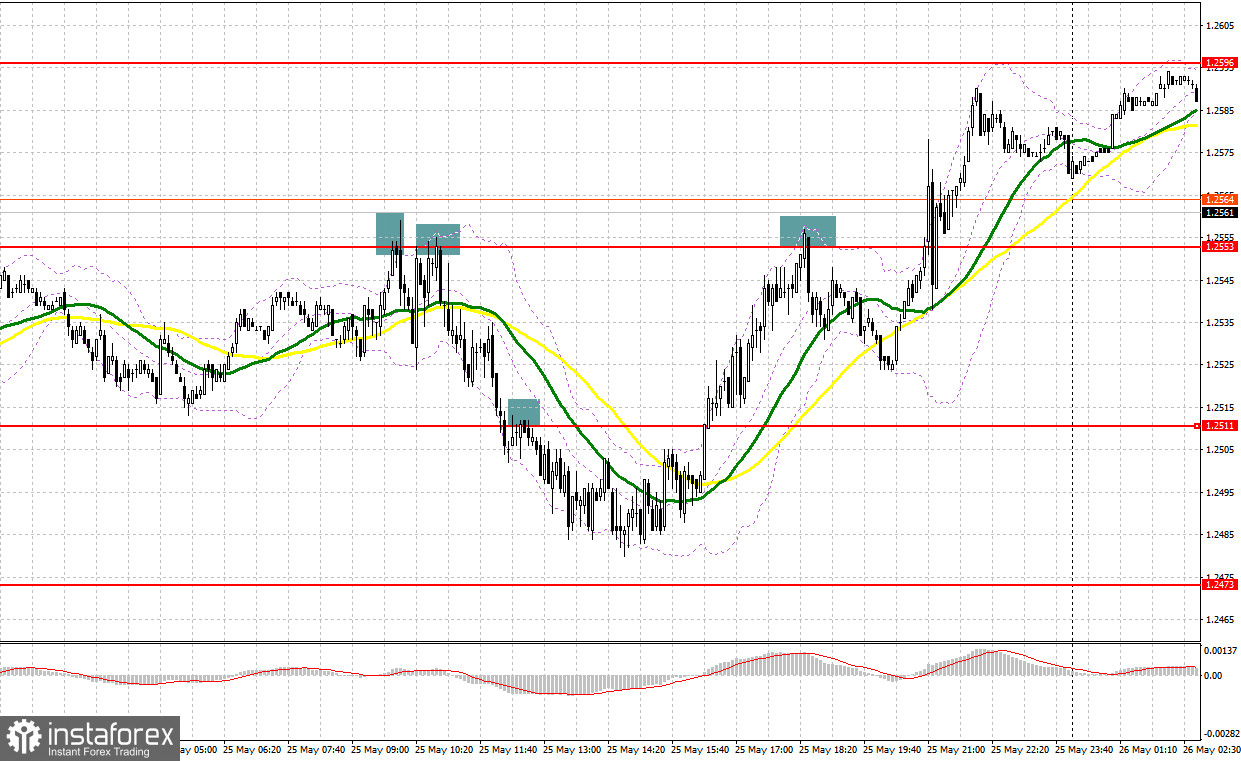
Yesterday, a fairly large number of excellent market entry signals were formed, which turned out to be quite profitable. Let's take a look at the 5-minute chart and see what happened. In my forecast, I paid attention to the level of 1.2553 and advised you to make decisions on entering the market from it. The growth and forming a false breakout at this level resulted in two excellent signals to sell the pound, which brought more than 80 points of profit. The breakthrough and reverse test from below 1.2511 became a signal to add to short positions, as a result of which the pair went down about 30 more points. The pound sharply rose in the afternoon, and only another false breakout at 1.2552 made it possible for us to show a downward movement by another 30 points.
When to go long on GBP/USD:
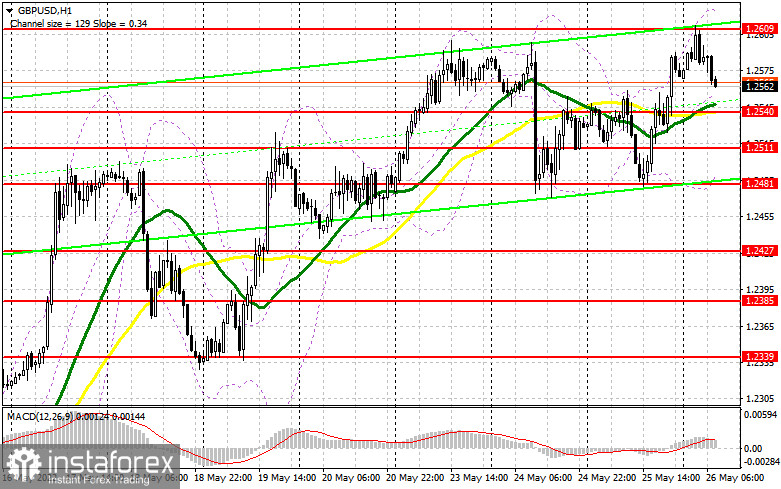
The Federal Reserve's minutes had a positive effect on the British pound, as investors did not find anything new in it that could harm the pair's bullish trend - observed since the middle of this month. Today's lack of statistics for the UK should help the bulls get to new monthly highs. No data - no problem. If the pound does not actively move up in the near future, bulls will have to think about protecting 1.2540, where the moving averages play on their side. Forming a false breakout at 1.2540 will lead to a signal to open new long positions, counting on the continuation of the bullish trend with a return to the weekly high of 1.2609, which we failed to get above in today's Asian session. It is possible to expect a sharper jerk of the pair, but only after consolidating above this range with a reverse test from top to bottom, which may occur in the first half of the day. This will open the way to new monthly highs in the area of 1.2652 and 1.2706, where I recommend taking profits.
The next target will be 1.2765. In case the pound falls and bulls are not active at 1.2540, the pressure will seriously increase, which will allow the pair to return to 1.2511. Therefore, I advise you not to rush into long positions. It is best to enter the market after a false breakout at this level. You can buy GBP/USD immediately on a rebound only from 1.2481 - a weekly low, or even lower - in the area of 1.2427, counting on correcting 30-35 points within the day.
When to go short on GBP/USD:
The bears are aiming for 1.2540, but going beyond this level will be quite problematic. Given the high volatility of the market, it is best, of course, to sell from the weekly high of 1.2609. A false breakout at this level, by analogy with what I analyzed above, will be an ideal condition for opening short positions in anticipation of a return and consolidation below 1.2540. Considering that the UK continues to release disappointing reports, it is too early to say that the situation will gradually improve, as this will limit the pair's upward potential. A breakthrough and reverse test from below 1.2540 creates a signal for short positions, allowing the pound to return to the 1.2511 area, opening a direct road to a weekly low of 1.2481, where I recommend taking profits.
The next target will be 1.2427, the test of which will cross out the upward trend in the pair. But hopes for the implementation of this scenario without good fundamental statistics on US GDP and its less active decline in the first quarter of this year are unlikely to succeed. In case GBP/USD grows and traders are not active at 1.2609, another upsurge may occur amid stop orders being dismantled. In this case, I advise you to postpone short positions until the next major resistance at 1.2652. I also advise you to open short positions there only in case of a false breakout. You can sell GBP/USD immediately for a rebound from the high of 1.2706, or even higher - from 1.2765, based on the pair's rebound down by 30-35 points within the day.
COT report:
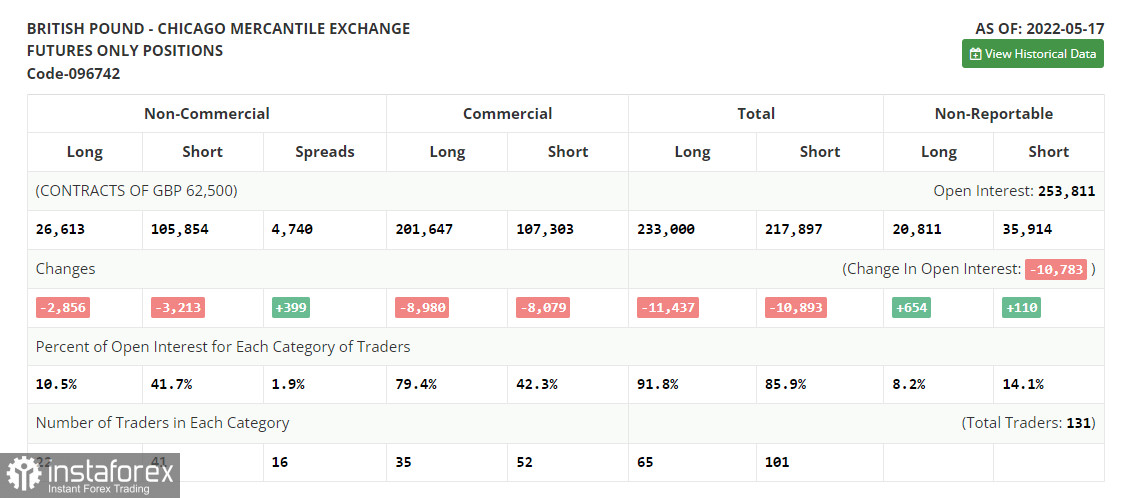
The Commitment of Traders (COT) report for May 17 showed that both long and short positions have decreased - the decline of the latter turned out to be much greater. This suggests that the market may be gradually approaching the bottom, and also that traders are enjoying quite attractive prices and despite the whole situation in the UK and uncertainty, they are gradually looking at the market.
I have repeatedly noted the presence of a number of problems in the UK economy, as a rather difficult situation with inflation and slowdown in economic growth make the Bank of England rush between two fires. But it is worth noting that despite all this, BoE Governor Andrew Bailey, in his recent interview noted that the central bank is not going to refuse to raise interest rates in the near future. But the same cannot be said about the policy of the Federal Reserve. Rumors have spread that the central bank plans to "pause" the cycle of raising interest rates as early as September this year, which will definitely have a negative impact on the positions of the US dollar and partially weaken it.
The May 17 COT report indicated that long non-commercial positions decreased by -2,856 to 26,613, while short non-commercial positions decreased by -3,213 to 105,854. level -79,598 to 79,241. The weekly closing price increased from 1.2313 to 1.2481.
Indicator signals:
Moving averages
Trading is conducted above the 30 and 50-day moving averages, which indicates an attempt by the bulls to continue the pair's growth.
Note: The period and prices of moving averages are considered by the author on the H1 hourly chart and differs from the general definition of the classic daily moving averages on the daily D1 chart.
Bollinger Bands
In case of a decline, the lower border of the indicator around 1.2510 will act as support. In case of growth, the area of 1.2609 will act as resistance.
Description of indicators
- Moving average (moving average, determines the current trend by smoothing out volatility and noise). Period 50. It is marked in yellow on the chart.
- Moving average (moving average, determines the current trend by smoothing out volatility and noise). Period 30. It is marked in green on the chart.
- MACD indicator (Moving Average Convergence/Divergence — convergence/divergence of moving averages) Quick EMA period 12. Slow EMA period to 26. SMA period 9
- Bollinger Bands (Bollinger Bands). Period 20
- Non-commercial speculative traders, such as individual traders, hedge funds, and large institutions that use the futures market for speculative purposes and meet certain requirements.
- Long non-commercial positions represent the total long open position of non-commercial traders.
- Short non-commercial positions represent the total short open position of non-commercial traders.
- Total non-commercial net position is the difference between short and long positions of non-commercial traders.


