Technical Market Outlook:
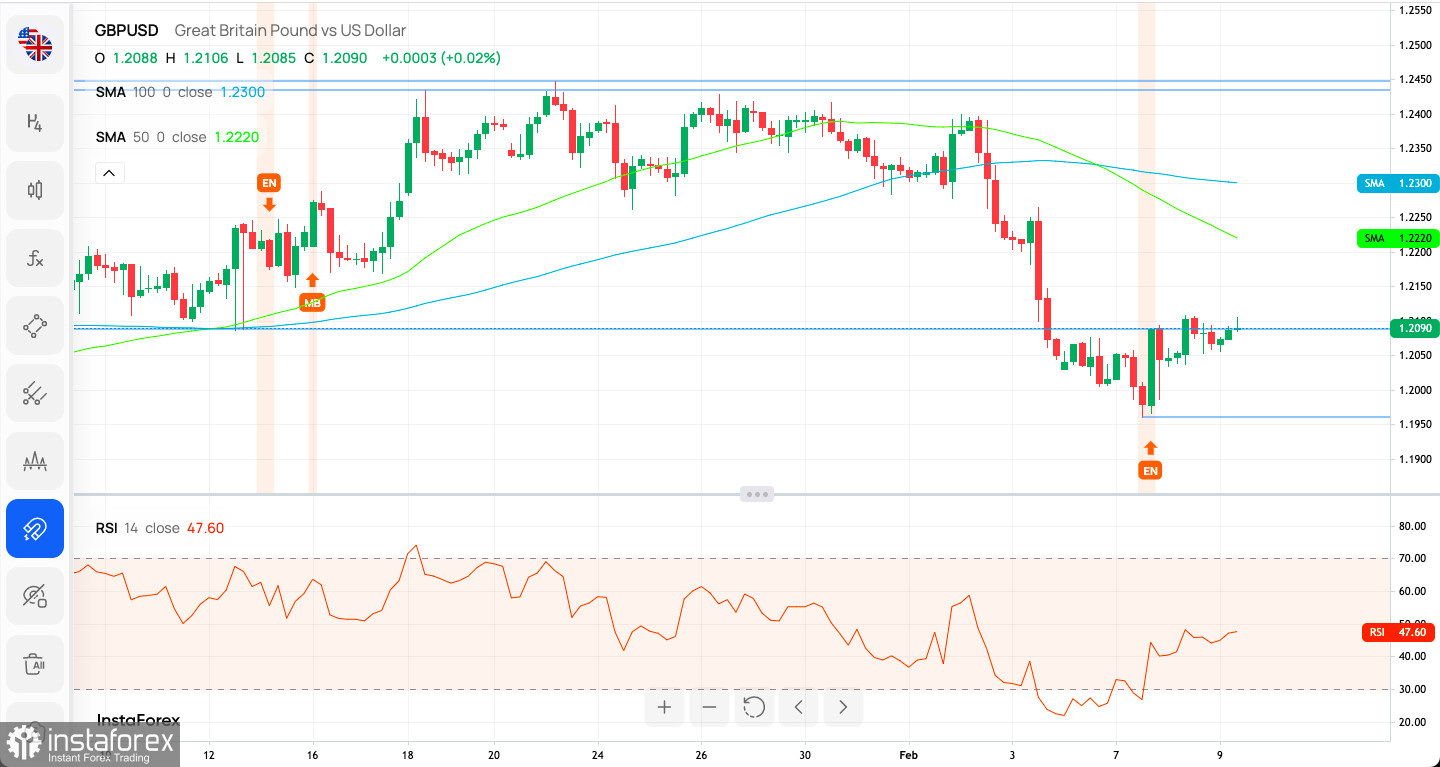
The GBP/USD pair had made Bullish Engulfing candlestick pattern at the level of 1.1960 on the H4 time frame chart and now is trying to break above the intraday key technical resistance located at 1.2086. The next target for bulls is seen at the level of 1.2220 (50 MA). The level of 1.2242 will now act as a technical resistance as well, so a breakout above this level of needed in order to rally higher. The momentum is weak and negative, however points to the north, so the short-term outlook is getting more and more bullish. Please be aware of the 50 MA and 100 MA bearish cross on the H4 time frame as well.

Weekly Pivot Points:
WR3 - 1.20749
WR2 - 1.20704
WR1 - 1.2068
Weekly Pivot - 1.20659
WS1 - 1.20635
WS2 - 1.20614
WS3 - 1.20569
Trading Outlook:
So far the level of 1.2443 was too strong resistance to break through, so a potential Double Top price pattern might be in play. Moreover, the level of 1.2297 which is 50% Fibonacci retracement level of the last big wave down had been hit, so the bears might resume the down trend. The confirmation of the pattern comes with the level of 1.2089 breakout with a potential target at the level of 1.1840.


