


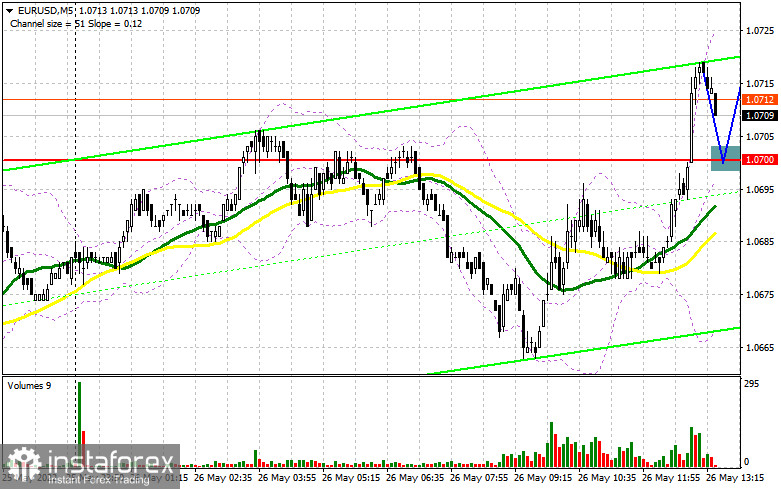
In the morning article, I highlighted the level of 1.0700 and recommended taking decisions with this level in focus. Now let's look at the 5-minute chart and try to figure out what actually happened. The empty economic calendar affected the trajectory of the euro. It was trading in a sideways channel in the first half of the day. The breakout of the nearest resistance level of 1.0700 occurred without a downward test. For this reason, I did not wait for new entry points. In the afternoon, the technical outlook slightly changed. However, the trading strategy remained the same.
What is needed to open long positions on EUR/USD
The bulls are still trying the regain control of the market. Their main task in the afternoon is to protect the new support level of 1.0695, formed following the results of the European session. The euro may decline to this level after the publication of US GDP data for the first quarter of this year. Analysts believe that the revised reading is likely to slightly change, bouncing from a negative figure to a positive one. It is recommended to open long positions at 1.0695 after a false breakout. It may give a buy signal with the price moving within the bullish trend. The pair could also advance to the weekly high of 1.0747. A new buy signal may appear after a breakout and a downward test of this level. It will open the path to a high of 1.0779 where I recommend locking in profits. A more distant target will be the 1.0811 level. If EUR/USD declines and bulls show no activity at 1.0695, which is possible, it is better to refrain from opening long positions. Use the same strategy if data on the US initial jobless claims and pending home sales is upbeat. It is better to wait for a false breakout near the high of 1.0645. I would advise you to open long positions immediately at a bounce from the 1.0603 level or even a low around 1.0561, keeping in mind an upward intraday correction of 30-35 pips.
What is needed to open short positions on EUR/USD
If the pair rises, only a false breakout of 1.0747, similar to the one I analyzed in the morning forecast, will generate a sell signal against the trend. The price may return to the support level of 1.0695, a new level formed in the morning. If the US macro stats are strong, especially the GDP figure, bears and bulls are likely to tussle for 1.0695. Therefore, if bears push the pair below this level and there is an upward test, a new sell signal will appear. It may erase the buyers' stop orders, dragging the pair down to 1.0645. I recommend locking in profit at this level. A more distant target will be the 1.0603 level. The price may reach this level only if bulls completely lose momentum. If EUR/USD grows in the European session and bears show no energy at 1.0747 due to weak US data, the uptrend may continue. It will strengthen the bullish trend that is currently being unfolded. EUR bulls are now relying on the statements of ECB policymakers. Their comments are getting more hawkish, signaling the possibility of a more aggressive monetary policy. It is better to open short positions after a false breakout of 1.0779. You can sell EUR/USD immediately after a bounce from 1.0811 or even a high around 1.0844, keeping in mind a downward intraday correction of 30-35 pips.
COT report
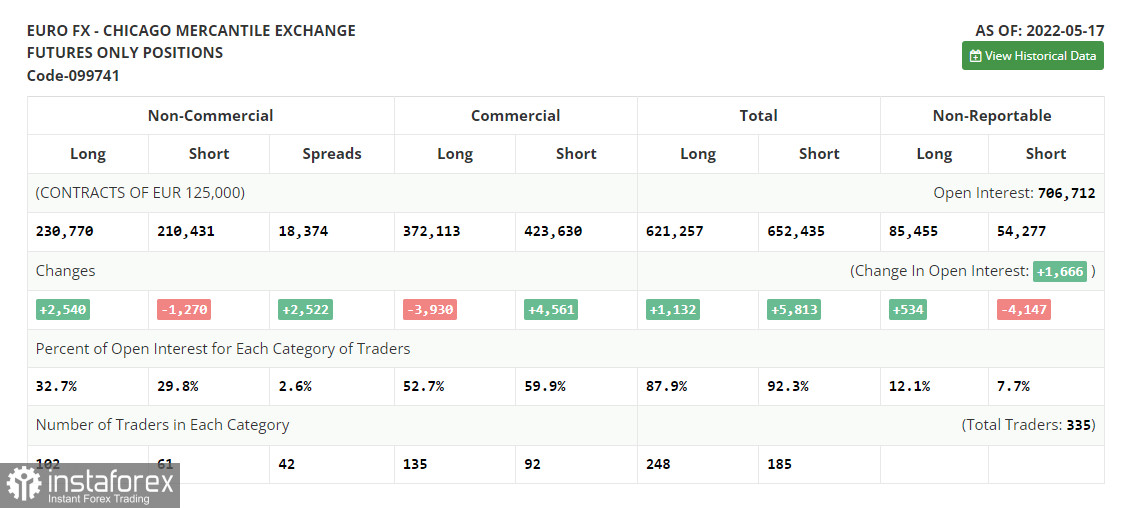
The COT report (Commitment of Traders) for May 17 logged a further increase in long positions and a decline in short ones. Traders are buying the asset at a rather low price amid the ECB's announcements about the upcoming key interest rate hike. Last week, various ECB policymakers confirmed this intention. The ECB is expected to hike the interest rate by a quarter-point in July this year, then in September and in December, raising it eventually to 0.25% by the end of the year. However, some European politicians are criticizing this plan. They are calling for more aggressive measures from the ECB to combat surging inflation. The interest rate is likely to be raised in September and December to 0.5% from the current zero level. The upward trend of the euro may be fueled by rumors that the Fed may slacken its monetary policy tightening in September after aggressive rate hikes in spring and summer. The COT report revealed that the number of long non-commercial positions increased by 2,540 to the level of 230,770 from the level of 228,230. The number of short non-commercial positions dwindled by -1,270 to the level of 210,431 from the level of 211,701. As I have mentioned more than once, the weaker euro is more attractive to traders. An upward reversal has only proved it. At the end of the week, the total non-commercial net position advanced to 20,339 against 16,529 a week earlier. The weekly closing price almost also climbed slightly and amounted to 1.0556 against 1.0546.
Signals of technical indicators
Moving averages
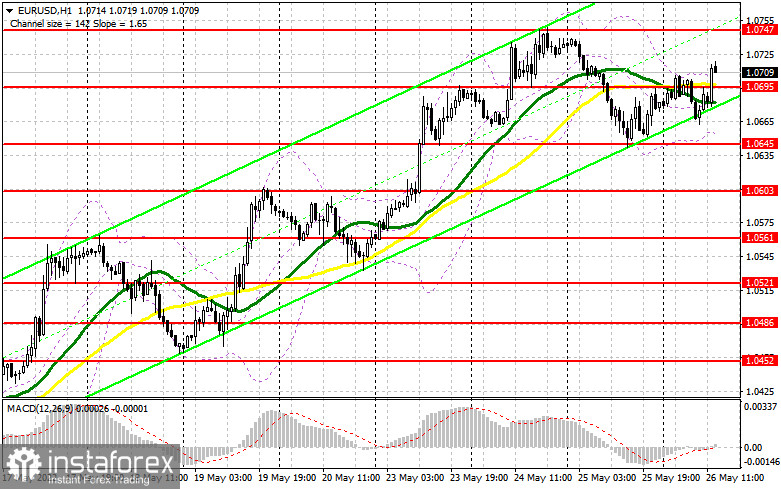
EUR/USD is trading near 30- and 50-period moving averages, which indicates market uncertainty.
Remark. The author is analyzing the period and prices of moving averages on the 1-hour chart. So, it differs from the common definition of classic daily moving averages on the daily chart.
Bollinger Bands
In case of a decline, the lower border around 1.0655 will act as support.
Definitions of technical indicators
- Moving average recognizes an ongoing trend through leveling out volatility and market noise. A 50-period moving average is plotted yellow on the chart.
- Moving average identifies an ongoing trend through leveling out volatility and market noise. A 30-period moving average is displayed as the green line.
- MACD indicator represents a relationship between two moving averages that is a ratio of Moving Average Convergence/Divergence. The
- MACD is calculated by subtracting the 26-period Exponential Moving Average (EMA) from the 12-period EMA. A 9-day EMA of the MACD called the "signal
- line".
- Bollinger Bands is a momentum indicator. The upper and lower bands are typically 2 standard deviations +/- from a 20-day simple moving
- average.
- Non-commercial traders - speculators such as retail traders, hedge funds, and large institutions who use the futures market for speculative purposes and meet certain requirements.
- Non-commercial long positions represent the total long open position of non-commercial traders.
- Non-commercial short positions represent the total short open position of non-commercial traders.
- The overall non-commercial net position balance is the difference between short and long positions of non-commercial traders.


