


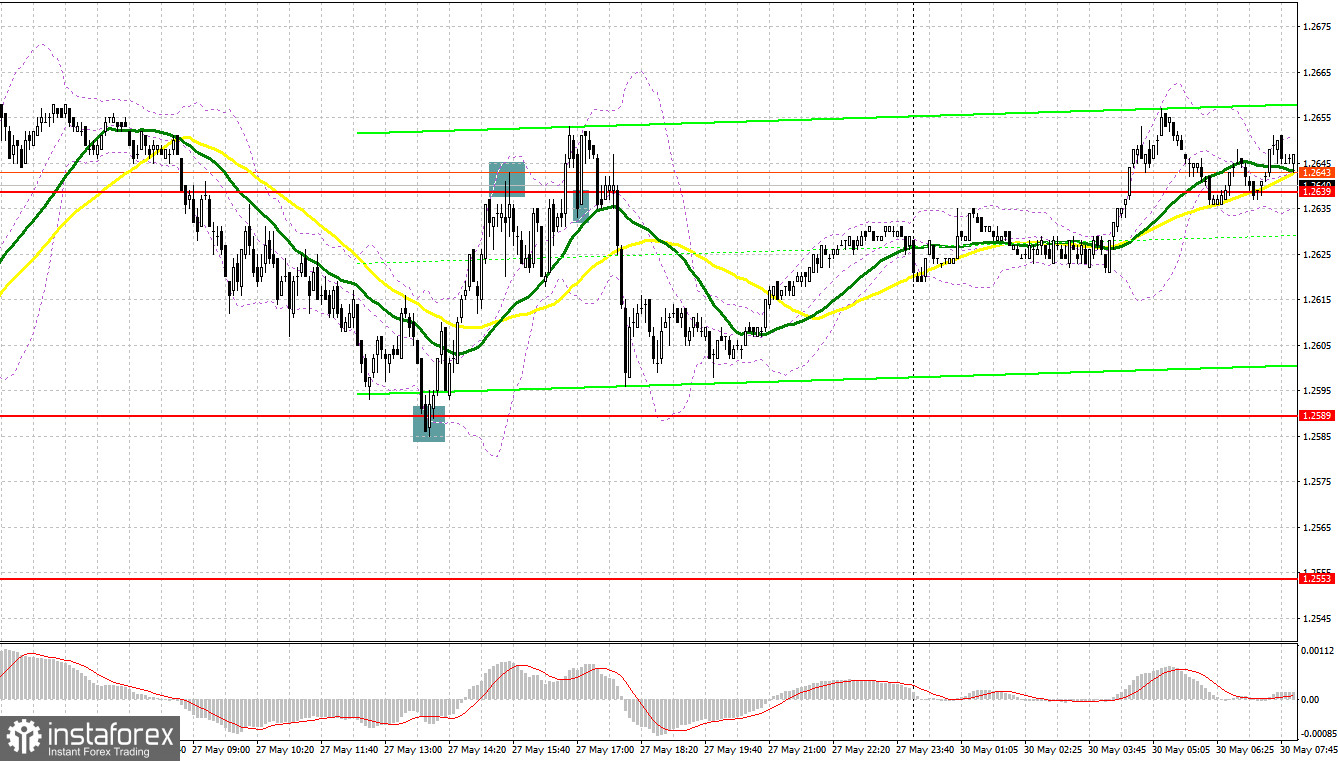
Several market entry signals were formed on Friday. Let's look at the 5-minute chart and see what happened. I paid attention to the level of 1.2617 in my morning forecast and advised you to make decisions on entering the market from it. A decline and forming a false breakout at the level of 1.2617 amid the absence of important fundamental statistics was quite expected. This resulted in a great signal for long positions, but to my regret, after moving up almost 20 points, the pair was under pressure again and we saw a retest of 1.2617. As a result, the deal was closed at breakeven, and I began to wait for other signals to appear. Gradual consolidation below 1.2617 led to a signal for short positions, however, I did not enter shorts, as it was difficult to imagine where the pair would continue to move in such a market – there was no directional sharp movement, so everything was 50/50. In the afternoon, I still waited for a test of the target support at 1.2589. Forming a false breakout on it led to an excellent entry point for buying the pound. As a result, there was an increase by 50 points to the area of 1.2639, which the bears actively defended. Failure to settle above and a false breakout at 1.2639 is a signal for shorts. But after moving down by 20 points, the demand for the pound returned.
When to go long on GBP/USD:
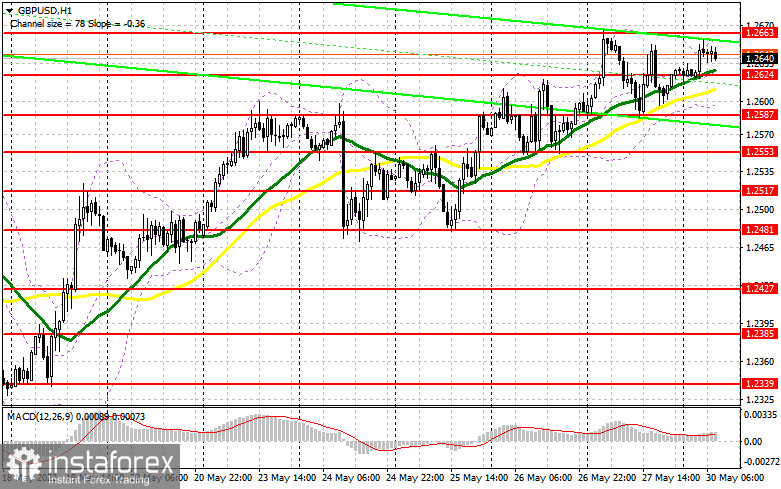
From the direction in which the formed triangle will be broken, the further direction of the pound depends from a technical perspective. The absence of statistics today and a holiday in the US can seriously affect the volatility of the pair, so I bet on an unsuccessful attempt to break through the upper border of the triangle and stay suspended in the horizontal channel at 1.2587-1.2663. The pound may rise amid the lack of statistics, as it was last week. If the pound does not actively move up in the near future, bulls will have to think about protecting 1.2624, where the moving averages are playing on their side. Forming a false breakout at this level will lead to a signal to open new long positions, counting on the continuation of the bullish trend with growth to the weekly high of 1.2663, which we failed to get above last Friday. A sharper jerk of the pair can be expected, but only after consolidating above this range with a reverse test from top to bottom, which can occur only in the first half of the day. This will open the way to new monthly highs in the area of 1.2709 and 1.2755, where I recommend taking profits.
The next target will be the area and 1.2798. If the pound falls and there are no bulls at 1.2624, and I think we will pass this level quite easily, the pressure on the pair will seriously increase. This will allow the pair to return to 1.2587. Therefore, I advise you not to rush into long positions. It is best to enter the market after a false breakout at this level. You can buy GBP/USD immediately on a rebound only from 1.2553, or even lower - in the area of 1.2517 with the goal of correcting 30-35 points within the day.
When to go short on GBP/USD:
The bears are aiming for 1.2624 and a disappointing report on the Nationwide UK House Price Index could help with that. At the end of the month, you can also count on big players closing part of their profits and a correction, but so far there are no serious prerequisites for this. The primary task is to return to 1.2626, or protect the monthly high of 1.2663 - whichever we touch on first. A false breakout at 1.2663, by analogy with what I analyzed above, will be an ideal condition for opening short positions in anticipation of a return and consolidation below 1.2624. A breakthrough and reverse test from below 1.2624 creates a signal for shorts, allowing GBP/USD to return to the 1.2587 area, opening a direct path to the 1.2553 low, where I recommend taking profits. The next target will be a weekly low at 1.2517. But even a test of this level will not greatly harm the developing trend, but will only slightly reassure active bulls.
In case GBP/USD grows and traders are not active at 1.2663, another upsurge may occur amid stop orders being dismantled. In this case, I advise you to postpone short positions until the next major resistance at 1.2709. I also advise you to open short positions there only in case of a false breakout. You can sell GBP/USD immediately for a rebound from a high like1.2755, or even higher - from 1.2798, based on the pair's rebound down by 30-35 points within the day.
COT report:
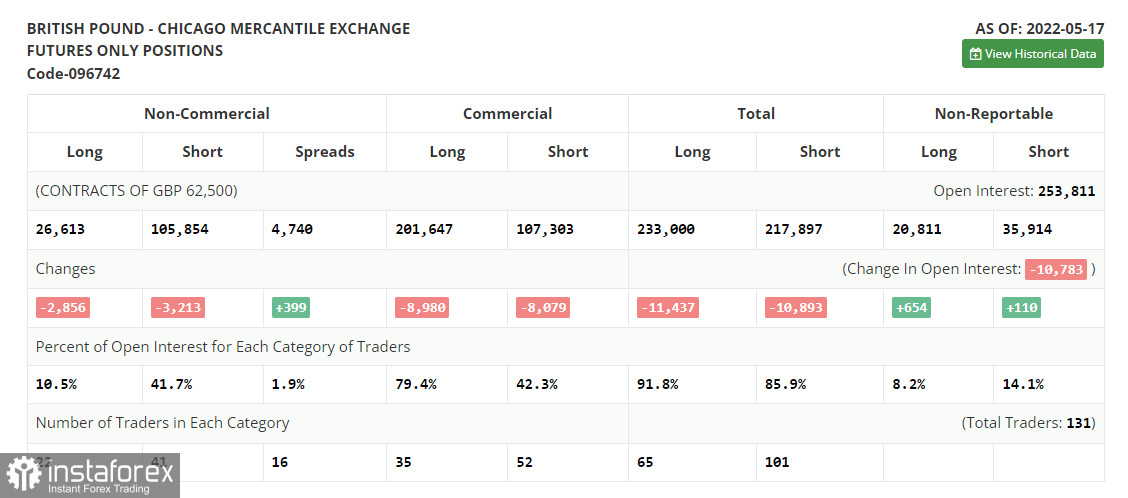
The Commitment of Traders (COT) report for May 17 showed that both long and short positions have decreased - the decline of the latter turned out to be much greater. This suggests that the market may be gradually approaching the bottom, and also that traders are enjoying quite attractive prices and despite the whole situation in the UK and uncertainty, they are gradually looking at the market.
I have repeatedly noted the presence of a number of problems in the UK economy, as a rather difficult situation with inflation and slowdown in economic growth make the Bank of England rush between two fires. But it is worth noting that despite all this, BoE Governor Andrew Bailey, in his recent interview noted that the central bank is not going to refuse to raise interest rates in the near future. But the same cannot be said about the policy of the Federal Reserve. Rumors have spread that the central bank plans to "pause" the cycle of raising interest rates as early as September this year, which will definitely have a negative impact on the positions of the US dollar and partially weaken it.
The May 17 COT report indicated that long non-commercial positions decreased by -2,856 to 26,613, while short non-commercial positions decreased by -3,213 to 105,854. level -79,598 to 79,241. The weekly closing price increased from 1.2313 to 1.2481.
Indicator signals:
Moving averages
Trading is conducted above the 30 and 50-day moving averages, which indicates an attempt by the bulls to continue the pair's growth.
Note: The period and prices of moving averages are considered by the author on the H1 hourly chart and differs from the general definition of the classic daily moving averages on the daily D1 chart.
Bollinger Bands
In case of a decline, the lower border of the indicator around 1.2590 will act as support. In case of growth, the area of 1.2660 will act as resistance.
Description of indicators
- Moving average (moving average, determines the current trend by smoothing out volatility and noise). Period 50. It is marked in yellow on the chart.
- Moving average (moving average, determines the current trend by smoothing out volatility and noise). Period 30. It is marked in green on the chart.
- MACD indicator (Moving Average Convergence/Divergence — convergence/divergence of moving averages) Quick EMA period 12. Slow EMA period to 26. SMA period 9
- Bollinger Bands (Bollinger Bands). Period 20
- Non-commercial speculative traders, such as individual traders, hedge funds, and large institutions that use the futures market for speculative purposes and meet certain requirements.
- Long non-commercial positions represent the total long open position of non-commercial traders.
- Short non-commercial positions represent the total short open position of non-commercial traders.
- Total non-commercial net position is the difference between short and long positions of non-commercial traders.


