


Hello, dear traders!
Here is an overview of yet another interesting currency pair, AUD/USD. This time, the focus will be on technical analysis. As a reminder, Australia's Reserve Bank is gradually tightening its monetary policy, which has an effect on the national currency.
Weekly
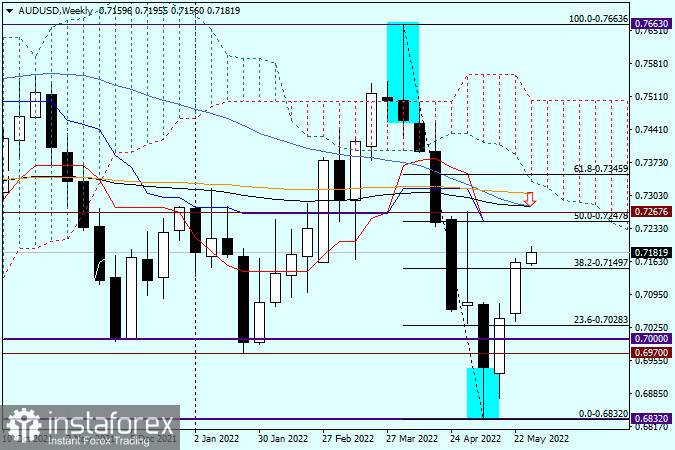
On the weekly chart, a bullish reversal took place after the formation of a bearish candlestick with a long lower shadow. The Aussie dollar now shows steady growth. In general, despite its high volatility, the Aussie dollar is a technical currency. Such a conclusion is made based on many years of experience with it. At this point, AUD/USD is in a corrective move. According to the Fibonacci grid, the quote has passed Fibonacci levels of 23.6 and 38.2. Bulls will now try to break through the Fibonacci level of 50, in line with the Tenkan and Kijun lines of the Ichimoku indicator. Slightly above, there are the MA 50, EMA 89, and EMA 200.
As for the pair's growth, it will become clear whether it is a correction or a reversal only after a succession of breaks through the outlined moving averages. The candlestick that emerged on the weekly chart at the very beginning of the month has a very long upper shadow, which indicates how strong the resistance zone of 0.7270-0.7300 is. Besides, tomorrow will be the last trading day of May. On the monthly chart, the candlestick has a long lower shadow and a bullish body. The pair is highly likely to show growth on the last trading day of the month. Meanwhile, the monthly candlestick could indicate the continuation of the bullish trend. However, it does not mean there have been no pullbacks. At the beginning of this week, AUD bulls continue pushing the price further up. Some important releases are scheduled for this week, including the US labor market report on Friday. In general, the uptrend seems more likely based on the technical picture of the daily chart. It remains to be seen how the price will behave if it reaches the green zone.
Daily
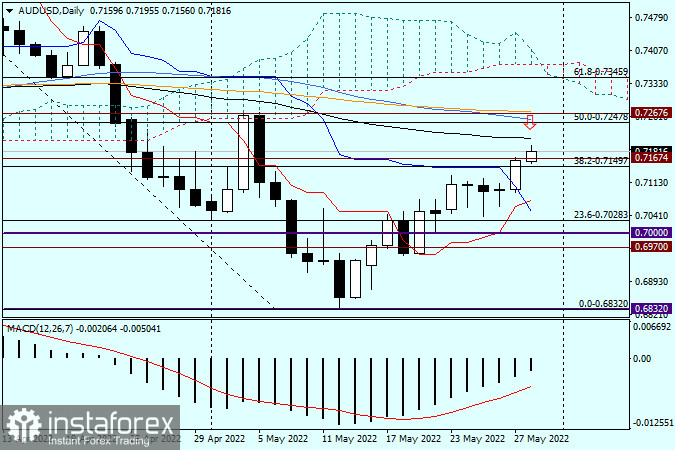
On the daily chart, after brief consolidation and a row of Doji candlesticks, the pair rallied on Friday, which confirms its strong growth potential. The future price movement will still depend on whether bulls break through the above-mentioned moving averages, with the closest one, the EMA 89, standing at 0.7212. In case of a failure, a bearish reversal candlestick pattern may emerge on the daily chart. If so, short positions could be considered. Meanwhile, long positions could be opened after consolidation above the resistance level of 0.7167. In both cases, it would be wiser to set smaller targets. Firstly, amid such a significant increase, a correction is needed. Secondly, there are many barriers on the pair's way upward. Anyway, amid the general weakening of the US dollar, AUD/USD is likely to remain bullish.
Good luck!


