


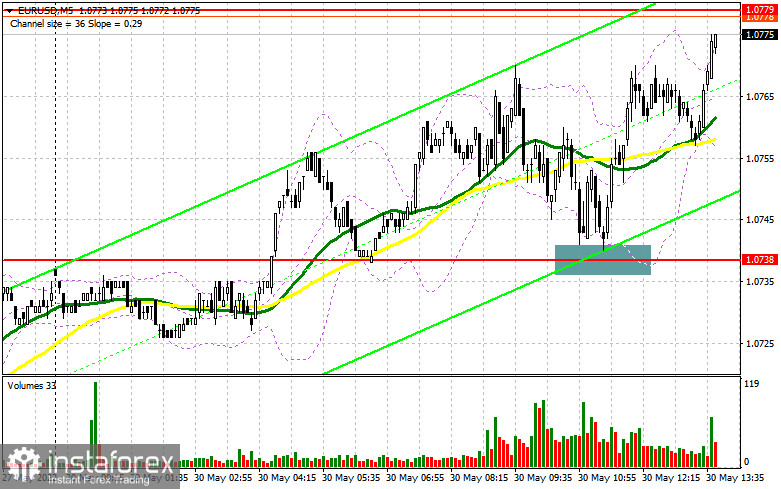
In the morning article, I highlighted the level of 1.0738 and recommended taking decisions with this level in focus. Now let's look at the 5-minute chart and try to figure out what actually happened. The euro quickly returned to the support level of 1.0738. However, it lacked just a few pips for the test of the indicated level. For this reason, I missed a false breakout and a buy signal. Those traders who did not wait for a precise pip-to-pip test of 1.0738 but opened long positions on the instrument a little earlier, had a great opportunity to enter the market within the bullish movement. For the second half of the day, the technical outlook has not changed.
What is needed to open long positions on EUR/USD
Given that the US trading floors are closed for the public holiday in the afternoon, volatility is likely to be extremely low, as well as trading volumes. This is exactly what I want to emphasize: low trading volumes may help the euro jump above 1.0779. After that, in the middle of the American session, the bears may quickly regain control over the market. The euro may also be trading around the nearest resistance level of 1.0779 which I advise you to keep in focus. There are also no macroeconomic reports today. Hence, the pair should stay in the sideways channel. It would be wise to open long positions near the support level of 1.0738. A false breakout of this level, a similar to one that occurred in the morning, will give a buy signal in the continuation of the bull market. If so, the pair may reach new highs above 1.0779. A new bug signal will appear after a breakout and a downward test of this level. It will open the way to 1.0811. The price is unlikely to approach a more distant target of 1.0844, today. However, taking into account the bullish trend, such a scenario is possible in the long term. If EUR/USD declines and bulls show no activity at 1.0738 in the afternoon, the pressure on the euro will increase significantly. Traders may start closing positions to lock in profits in anticipation of a larger downward correction. In this case, I advise you to refrain from opening long positions. It is better to wait for a false breakout near the low of 1.0703. It is recommended to open long positionsimmediately at a bounce from the level of 1.0665 or even a low around 1.0630, keeping in mind an upward intraday correction of 30-35 pips.
What is needed to open short positions on EUR/USD
As I have already mentioned in the morning article, bears should push the pair below the level of 1.0738 if they want to take control. They failed to do so in the first half of the day. So, now they are focused on the nearest resistance level of 1.0779. Only a false breakout of this level will give an excellent sell signal against the trend. The price may drop to 1.0738. A breakout and consolidation below 1.0738, as well as an upward test of this level, will generate a new sell signal, easing buyers' stop orders. As a result, the pair is likely to slide down to 1.0703. I recommend locking in profits at this level. A more distant target will be the 1.0665 level where I advise you to close short positions. However, it may be quite difficult for the pair to reach this level due to the lack of important economic reports and a public holiday in the United States. If EUR/USD climbs higher in the afternoon and bears show no energy at 1.0779, the uptrend will continue. It will significantly strengthen bullish momentum. Hence, the pair could hit new monthly highs. It is better to open short positions after a false breakout of 1.0811. You can sell EUR/USD immediately at a bounce of 1.0844 or even a high around 1.0894, keeping in mind a downward intraday correction of 30-35 pips.
COT report
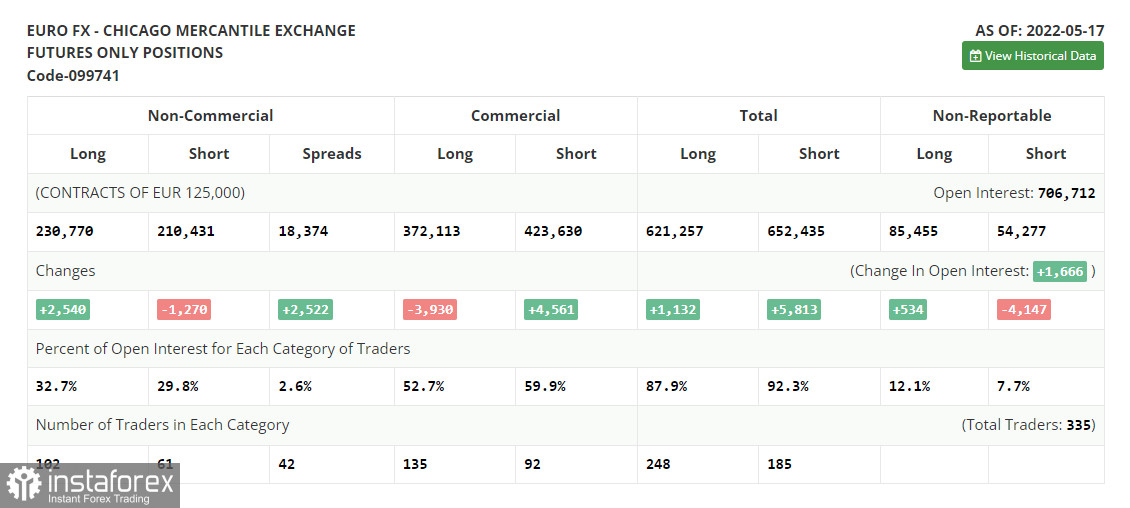
The COT report (Commitment of Traders) for May 17 logged a further increase in long positions and a drop in short ones. Traders continue to buy the instrument at lows amid the ECB's statements about the possibility of rate hikes in the near future. Policymakers of various central banks mentioned such a scenario several times last week. The ECB is expected to raise the interest rate by a quarter-point in July this year, followed by rate hikes in September and in December. Therefore, the regulator intends to increase the benchmark rate to 0.25% by the end of the year. However, the ECB is widely criticized for this plan as economists have been anticipating more aggressive measures to combat soaring inflation in the eurozone. The watchdog is likely to hike the key rate in September and December to 0.5% from the current zero level. The upward movement of the euro may be fueled by rumors that the Fed could take a pause in its tightening cycle in September after aggressive rate increases in spring and summer. The COT report revealed that the number of long non-commercial positions increased by 2,540 – to the level of 230,770 from the level of 228,230. The number of short non-commercial positions declined by -1,270 to the level of 210,431 from the level of 211,701. As I have already mentioned, the weaker euro is more attractive to traders. The current buoyant rise confirms it. At the end of the week, the total non-commercial net position grew to 20,339 against 16,529 a week earlier. The weekly closing price also increased slightly to 1.0556 against 1.0546.
Signals of technical indicators
Moving averages
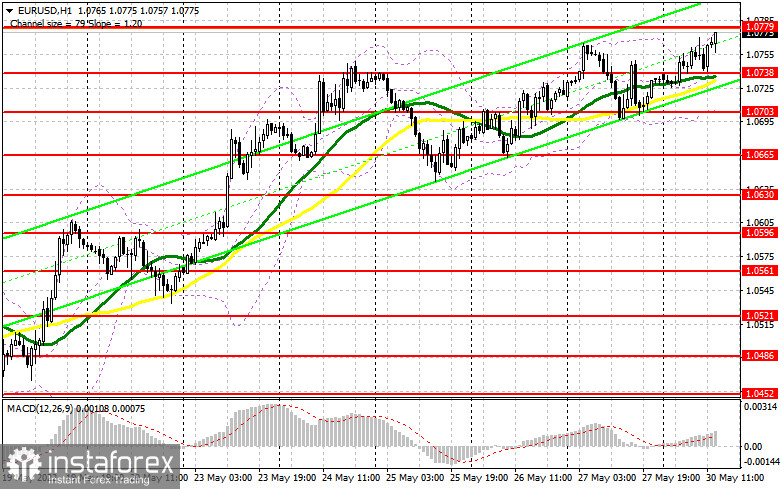
EUR/USD is trading above 30- and 50-period moving averages. It means that the bulls don't give up attempts to hold control.
Remark. The author is analyzing the period and prices of moving averages on the 1-hour chart. So, it differs from the common definition of classic daily moving averages on the daily chart.
Bollinger Bands
In case of a decline, the lower border around 1.0703 will act as support.
Definitions of technical indicators
- Moving average recognizes an ongoing trend through leveling out volatility and market noise. A 50-period moving average is plotted yellow on the chart.
- Moving average identifies an ongoing trend through leveling out volatility and market noise. A 30-period moving average is displayed as the green line.
- MACD indicator represents a relationship between two moving averages that is a ratio of Moving Average Convergence/Divergence. The
- MACD is calculated by subtracting the 26-period Exponential Moving Average (EMA) from the 12-period EMA. A 9-day EMA of the MACD called the "signal
- line".
- Bollinger Bands is a momentum indicator. The upper and lower bands are typically 2 standard deviations +/- from a 20-day simple moving
- average.
- Non-commercial traders - speculators such as retail traders, hedge funds, and large institutions who use the futures market for speculative purposes and meet certain requirements.
- Non-commercial long positions represent the total long open position of non-commercial traders.
- Non-commercial short positions represent the total short open position of non-commercial traders.
- The overall non-commercial net position balance is the difference between short and long positions of non-commercial traders.


