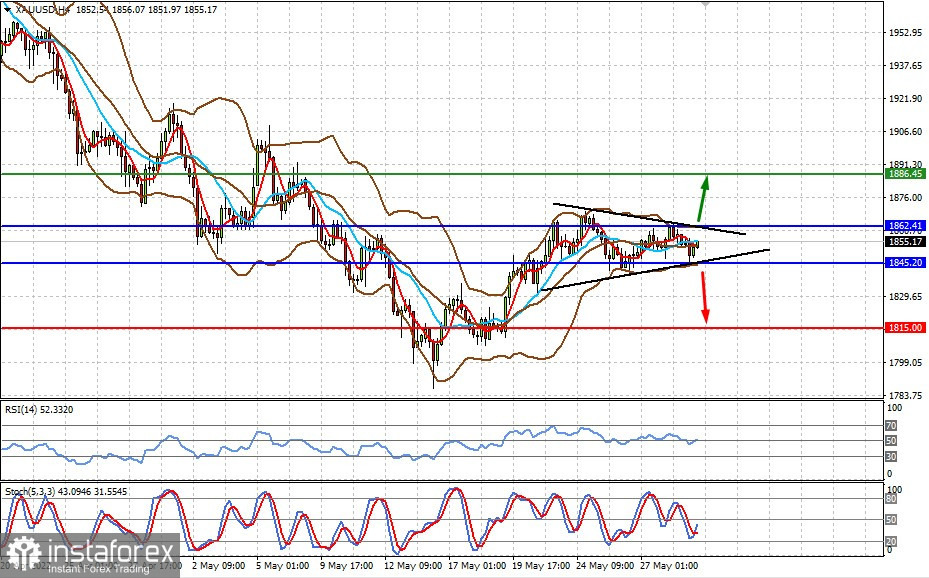
Gold is consolidating in a tight range, forming an ambiguous equilateral triangle pattern that can shoot up or down. The reason for this is the upcoming data from the US labor market, which will be released this week.
technical picture:
The quote is just above the middle line of the Bollinger indicator, between the SMA 5 and SMA 14. The relative strength index (RSI) lies at the 50% level and is moving horizontally, while the stochastic indicator is turning up.
Possible dynamics:
Spot gold will either receive significant support or will be under strong pressure after respectively overcoming the levels of 1862.40 and 1845.20/ If that happens, it will hit 1886.45 or fall to 1815.00.


