EUR/USD 5M

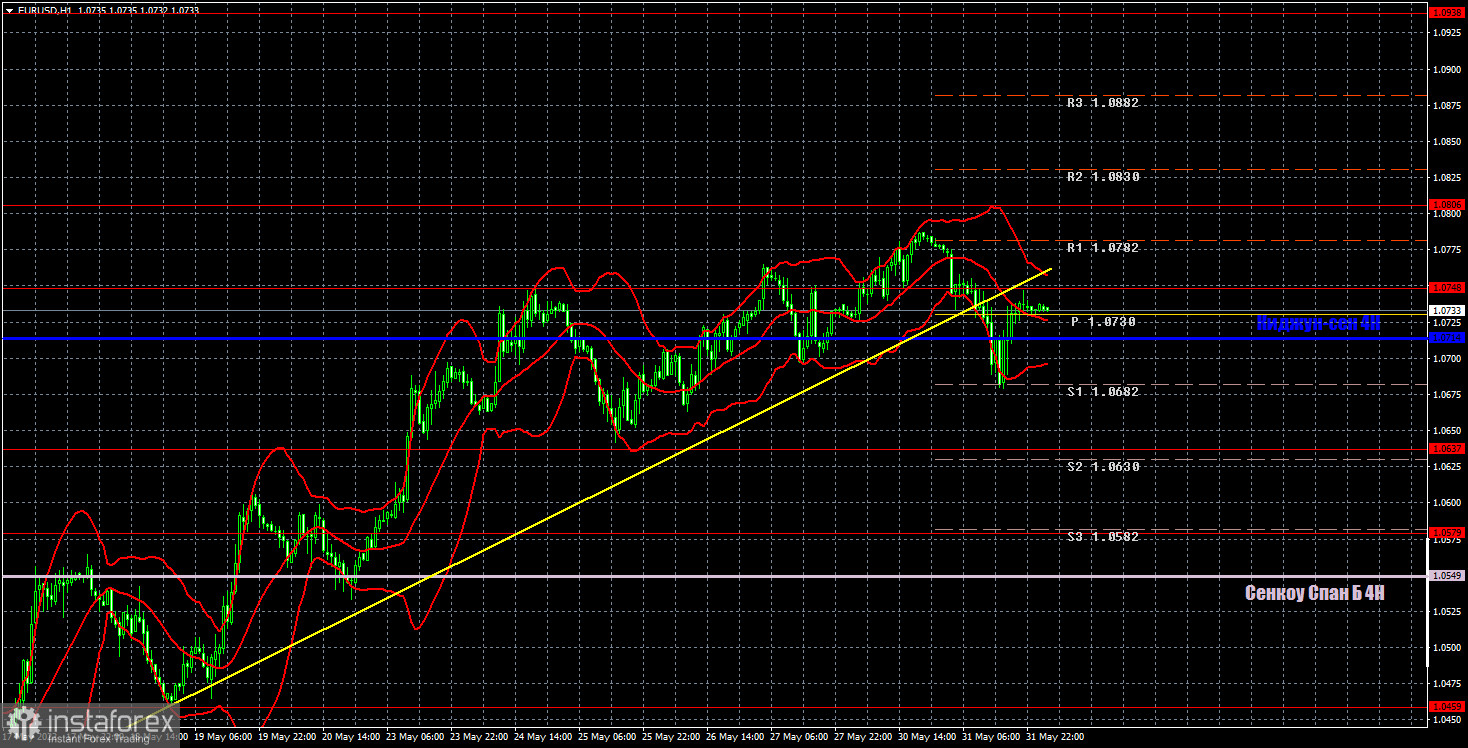
The EUR/USD pair still consolidated below the ascending trend line on Tuesday. Recall that in the past few days, the price has been approaching this line all the time, and the upward momentum has weakened. Yesterday's breakthrough of the trend line opens up prospects for bears, and puts the euro in a very uncomfortable position. On the one hand, it is still too early to talk about the end of the upward trend. There was no clear breakthrough of the critical line, and the technical factor may support the euro for several more weeks. On the other hand, we have a clear sell signal, so if the pair fails to return to its local highs and update them in the coming days, then a new decline will most likely begin. During the past day, traders could pay attention to only one report. We are talking about inflation in the EU, which continued to accelerate and amounted to 8.1% Y/Y in May. Thus, it has almost caught up with US inflation. But, if the Federal Reserve has raised rates in the past and intends to do so in the future, then the European Central Bank is still beating around the bush with its tightening of monetary policy. The euro again has more fall factors than growth.
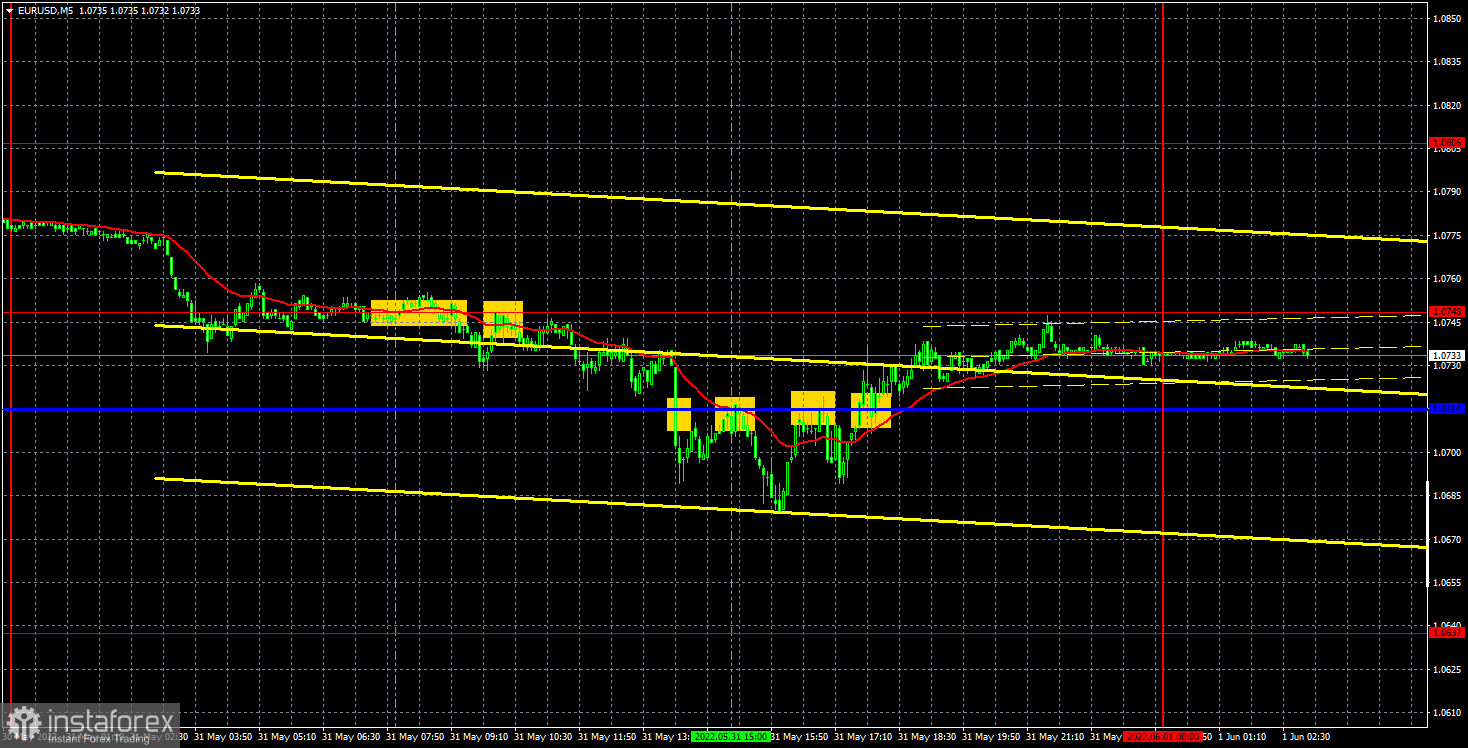
As for trading signals, they were not the best on Tuesday. The first two for short positions were formed at the very beginning of the European trading session, when the price overcame and rebounded from the level of 1.0748. Subsequently, the price overcame the Kijun-sen line, but failed to reach the next target. Therefore, it was necessary to open short positions around 1.0748, and they could be closed when the price settled back above the critical line. As a result, the profit on this transaction amounted to about 15 points. It was also possible to open long positions on the last buy signal, but still the signal was formed rather late. In any case, it was not unprofitable, since the pair did not go back below the critical line.
COT report:

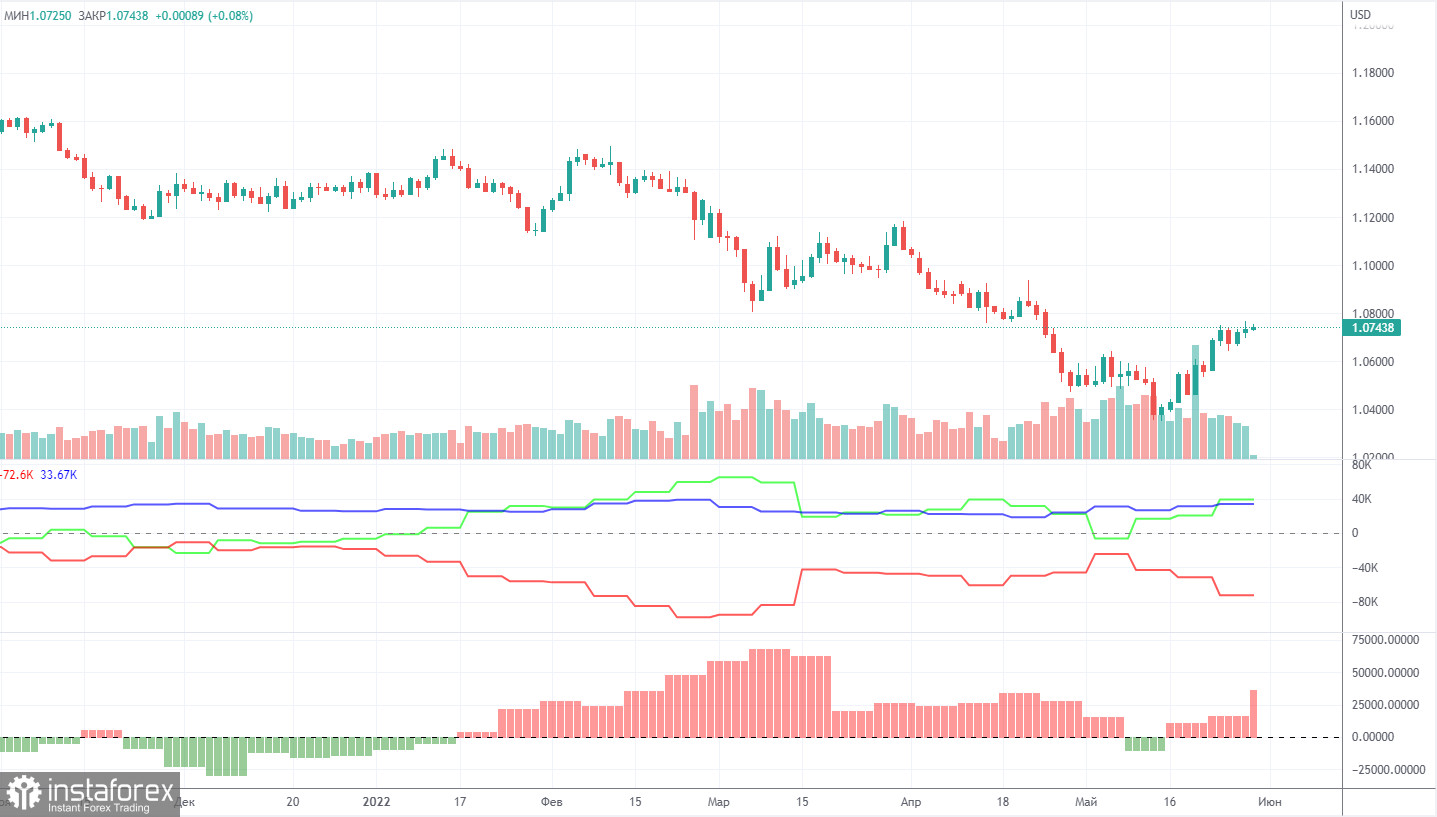
The latest Commitment of Traders (COT) reports on the euro raised a lot of questions. Recall that in the past few months, they showed a blatant bullish mood of professional players, but the euro fell all the time. Now the situation has begun to change, but not at the expense of the market players themselves, but due to the fact that the euro has begun to grow. That is, the mood of traders remains bullish (according to COT reports), and the euro began to grow due to the fact that it needs to be corrected from time to time. During the reporting week, the number of long positions increased by 6,300, while the number of shorts in the non-commercial group decreased by 12,200. Thus, the net position grew by 18,500 contracts per week. The number of long positions exceeds the number of short positions for non-commercial traders by 40,000 already. From our point of view, this happens because the demand for the US dollar remains much higher than the demand for the euro. Now a certain "respite" has begun for the euro, but this does not mean that tomorrow the global downward trend will not resume, and the data from COT reports will not continue to contradict the real state of things on the market. We therefore believe that such reporting data still cannot be relied upon for forecasting. At this time, both on the 4-hour timeframe and on the hourly there are clear trends, trend lines, and channels that indicate where the pair will move next. It is better to rely on them when making trading decisions.
We recommend that you familiarize yourself with:
Overview of the EUR/USD pair. June 1. The sixth package of sanctions from the EU against Russia has been agreed after all.
Overview of the GBP/USD pair. June 1. The problem of the "Northern Ireland Protocol" is becoming more acute.
Forecast and trading signals for GBP/USD on June 1. Detailed analysis of the movement of the pair and trading transactions.
EUR/USD 1H

It is clearly seen on the hourly timeframe that the price has settled below the trend line, so the upward trend is formally over. However, we believe that it will be possible to count on a new fall of the euro after a new breakthrough of the critical line. It is quite possible that the pair will continue to grow, despite the overcoming of the trend line. This signal needs confirmation. Today we highlight the following levels for trading - 1.0459, 1.0579, 1.0637, 1.0748, 1.0806, 1.0938, as well as Senkou Span B (1.0549) and Kijun-sen (1 .0714). Ichimoku indicator lines can move during the day, which should be taken into account when determining trading signals. There are also secondary support and resistance levels, but no signals are formed near them. Signals can be "rebounds" and "breakthroughs" extreme levels and lines. Do not forget about placing a Stop Loss order at breakeven if the price has gone in the right direction for 15 points. This will protect you against possible losses if the signal turns out to be false. Today the European Union is set to publish a report on business activity in the manufacturing sector, and we also have a speech from ECB President Christine Lagarde. Meanwhile, reports on business activity and ADP on changes in the number of employees in the private sector will be released in the US.
Explanations for the chart:
Support and Resistance Levels are the levels that serve as targets when buying or selling the pair. You can place Take Profit near these levels.
Kijun-sen and Senkou Span B lines are lines of the Ichimoku indicator transferred to the hourly timeframe from the 4-hour one.
Support and resistance areas are areas from which the price has repeatedly rebounded off.
Yellow lines are trend lines, trend channels and any other technical patterns.
Indicator 1 on the COT charts is the size of the net position of each category of traders.
Indicator 2 on the COT charts is the size of the net position for the non-commercial group.


