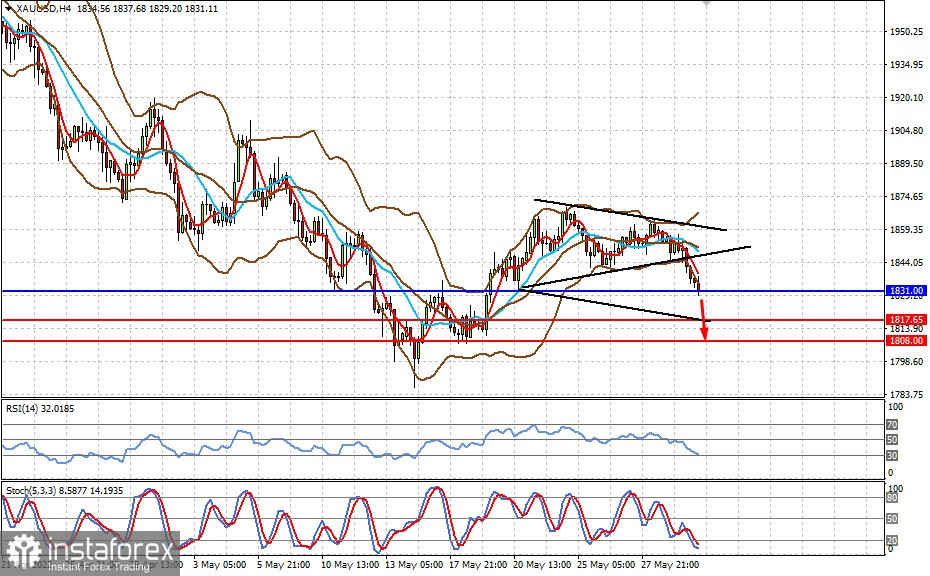
Gold broke out of the ambiguous triangle pattern because demand for dollar rose again yesterday. Most likely, further negative sentiment will lower prices even more.
Technical picture:
The quote is under the bottom line of the Bollinger indicator, below SMA 5 and SMA 14. The relative strength index (RSI) lies at the border of the oversold zone, while the stochastic indicator is already inside it.
Possible dynamics:
A decline and consolidation below 1831.00 will provoke further fall first to 1817.65 and then to 1808.00.