


Today, we will analyze the results of the monthly session and try to figure out where the GBP/USD quote will move next.
Monthly chart
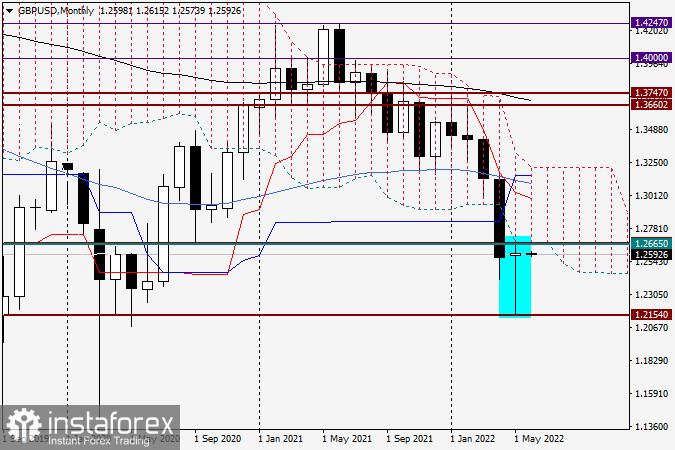
By the end of May, we could observe a candlestick with almost no body and a very long shadow on the monthly chart. After dropping to 1.2154, the pair reversed sharply higher from strong support and closed the May session at the level of 1.2597. In fact, this candlestick can be taken as a reversal signal. The closing price of the month was just below the strong technical level of 1.2600, which confirms the importance of this level for the market. If the last candlestick signals a reversal, bulls will focus on monthly highs found at 1.2665. Please note that the lower boundary of the monthly Ichimoku Cloud is located just above this level. It may limit the upside potential of the pound. Yet, based on the shape of the last candlestick, the upward movement seems more likely. In this scenario, the nearest upward targets will be the levels of 1.2665, 1.2677, and 1.2700 or even higher targets that are still too far away. The pound/dollar bears will need to retest the recent lows and break through the support level of 1.2154, which seems quite a difficult task now.
Daily chart
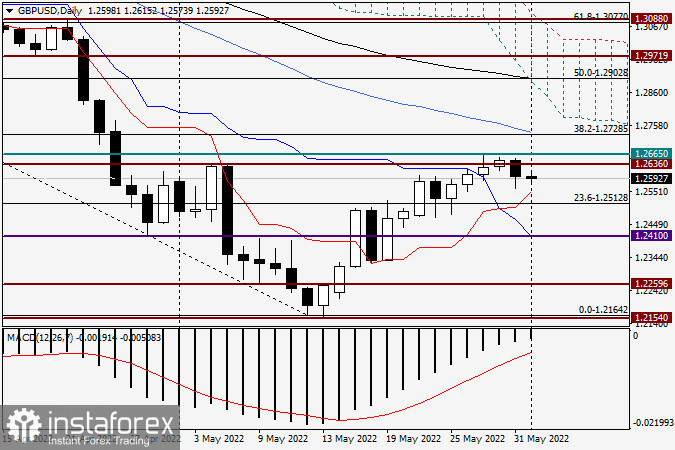
On the daily chart, the GBP/USD pair actually followed the trajectory of EUR/USD. By the end of yesterday's session, a bearish candlestick with a long lower shadow appeared on the chart. The shadow is a bit shorter than the one that appeared yesterday on the EUR/USD chart, but its presence may suggest the further rise in the quote. A return of the price below the resistance level of 1.2636 will cancel this scenario. Therefore, you should remember that the close of the candlestick below or above a certain level does not always mean a true breakout.
H4 chart
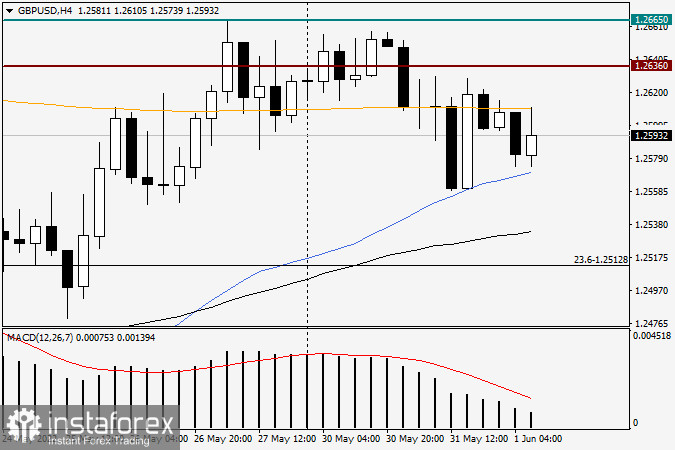
At the moment of writing, the orange 200-day exponential moving average serves as strong resistance for the bulls on the 4-hour chart. At the same time, the blue 50-day simple moving average stops the price from a possible decline. The situation is very ambiguous. Yet, I would prefer to buy the pair after short pullbacks to 1.2570, 1.2535, or even lower, on its way to a significant technical and psychological level of 1.2500. However, a drop to the 1.25 area may encourage bears to push the quote to the downside. As the article is being completed, the pound/ dollar pair is struggling to break above the level of 1.2600 and settle there. This is why there may be no pullbacks to the above-mentioned levels. On the other hand, it is not a good idea to buy the pair under strong resistance as it is not right from a technical point of view. So, the trajectory of the pound still looks confusing.
Have a good day!


