


Hi, dear traders!
Expectations of a 50 basis point increase by the ECB in late summer or early autumn 2022 have not given any support to the euro, which desperately needs it. The European Central Bank's position on monetary tightening is too vague and inconsistent. Today's data releases are the EU PPI data, the ADP payroll report in the US, the US initial jobless claims data, and the factory orders report. This week's main event on the economic calendar is nonfarm payroll data, which will be released tomorrow. While some major commercial banks assume nonfarm payrolls are not particularly important in this situation, this data release is likely to attract the attention of investors after the pessimistic US GDP data. Disappointing payrolls are likely to make the Fed reconsider its hawkish monetary policy.
Daily
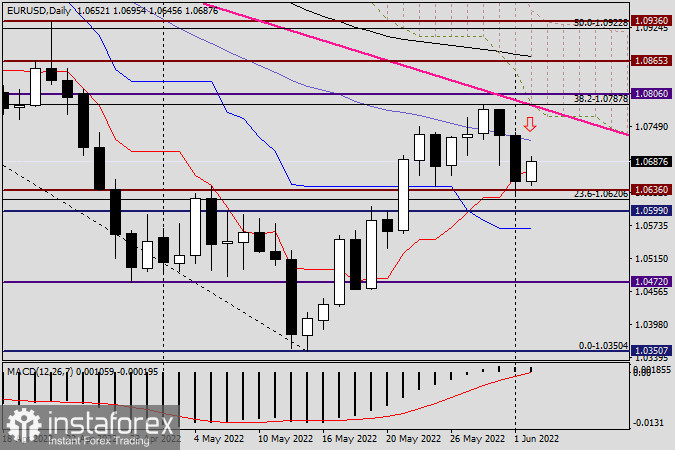
EUR/USD did not match yesterday's outlook - it dropped to the broken resistance level of 1.0636 and closed below the key technical level of 1.0700. The 50-day SMA line continues to be a strong obstacle for the pair's upside movement. EUR/USD closed above it only once - on April 30. At the time of writing, the pair rebounded upwards, trying to regain 1.0700. The closest resistance for EUR/USD lies in the 1.0700-1.0725 area, while support lies near 1.0636.
H1
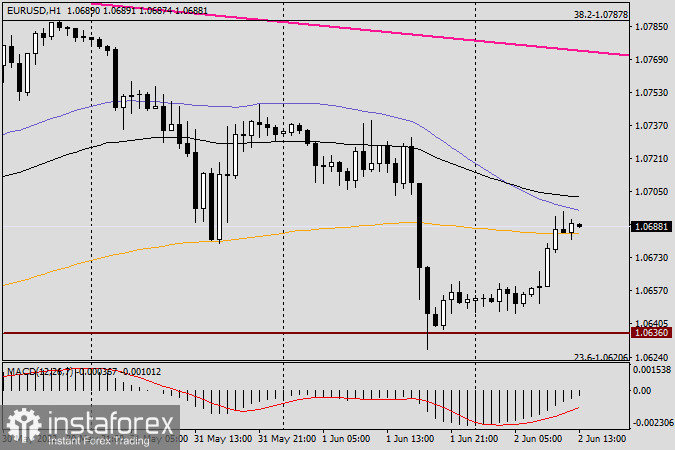
According to the H1 chart, bullish traders are trying to push the pair above 1.0700. The black 89 EMA and blue 50 SMA lines lie at this level. The unclear trend in the market and the importance of tomorrow's data releases allow opening both long and short positions. However, going short seems to be more important in this situation. Short positions can be opened if bearish reversal patterns appear below the 50 SMA and 89 EMA lines. At the moment of writing, EUR/USD tested the orange 200 EMA line. If it fails to break through it and bearish candles appear below 200 EMA, it would serve as a sell signal. However, the pair has already advanced upwards significantly, making these short positions more risky.
Good luck!


