


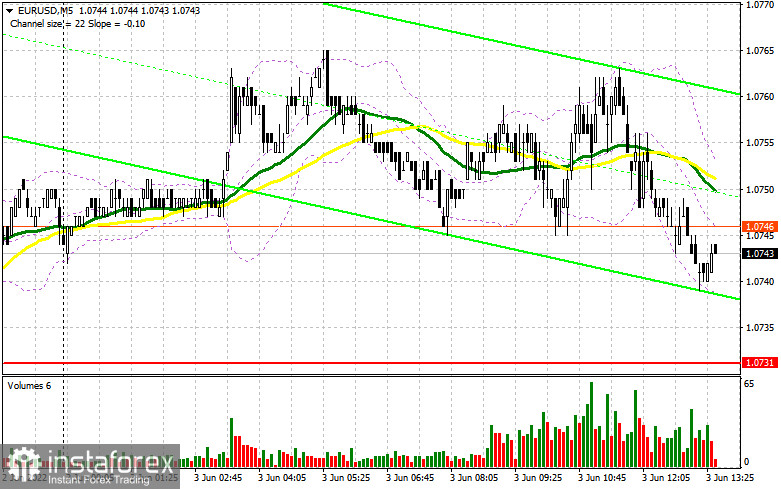
In the morning article, I highlighted the several levels and recommended taking decisions with those levels in focus. Now let's look at the 5-minute chart and try to figure out what actually happened. Given that the results of the macroeconomic reports were mainly in line with the economists' forecasts, the volatility in the EUR/USD pair in the first half of the day was fairly low. It amounted to about 25 pips. The pair failed to approach the anticipated support and resistance levels. There were also no signals to enter the market. In the afternoon, the technical outlook of the pair changed but the trading strategy remained the same.
What is needed to open long positions on EUR/USD
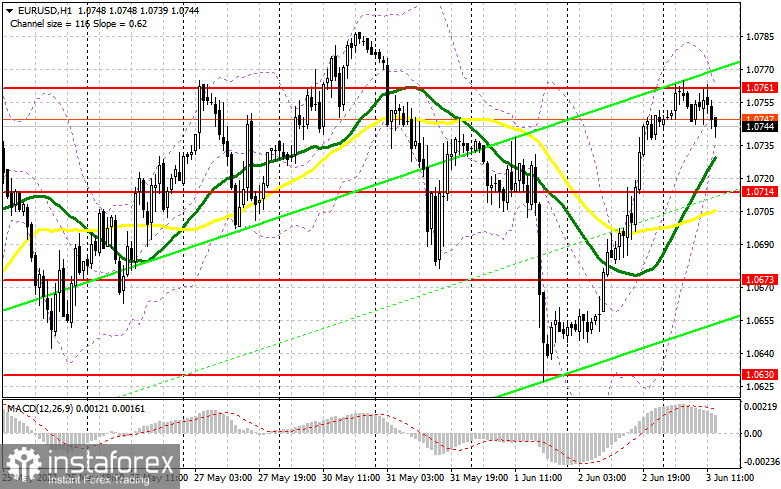
Today, traders will focus their full attention on the Nonfarm Payrolls report as well as the US unemployment rate data. If the figure turns out to be significantly worse than anticipated, the pressure on the US dollar will increase. Analysts expect a significant drop in May compared to April. In this case, the pair will certainly reach the highs of last month. If the report reveals that the labor market remains strong amid monetary policy tightening, the euro is likely to lose momentum at the end of the week. The US dollar, on the contrary, may climb. Other reports that are due today are unlikely to be of great interest to traders. If EUR/ USD decreases following the NFP report, it is recommended to open long positions only after a false breakout at the level of 1.0714. The moving averages are passing in the bullish territory above this level. This is the only way to get a buy signal on the euro in continuation of the bullish trend that appeared last month. The pair is projected to approach the resistance level of 1.0761. However, it will hardly grow above this level today. A breakout and a downward test of this level will give a new buy signal. Thus, the price could also advance to the May high of 1.0805 where I recommend locking in profits. A more distant target will be the 1.0853 level. If EUR/USD declines and bulls show no activity at 1.0714 in the afternoon, the euro may tumble significantly. EUR bulls will rush to close stop-loss orders below this level. If so, it will trigger a largerdownward correction to 1.0673. The best option for opening long positions will be a false breakdown at this level. It is better to open long positions on EUR/USD immediately at a bounce from 1.0630 or even a low of 1.0596, keeping in mind an upward intraday correction of 30-35 pips.
What is needed to open short positions on EUR/USD
Bears are sitting on the sidelines today in anticipation of NFP data. Their main goal today is to protect the nearest resistance of 1.0761 as well as push the price below 1.0714 at the end of the week. As a result, the pair will be trapped in the sideways channel and undermine the bull momentum that appeared in mid-May. In case of weak data on the US labor market, bears are sure to clench their paws on the US dollar. The latter may slide down to 1.0761. Only a false breakout of this level will generate a sell signal against the trend. Therefore, the pair is likely to drop to the support level of 1.0714. A decline below 1.0714, as well as an upward test of this level and hawkish statements by Fed policymakers on inflation, will give a sell signal. EUR buyers will start closing stop-loss orders, which may push the pair to the low of 1.0673. If this scenario comes true, it is recommended to close some of the short positions. A more distant target will be the 1.0630 level where I would advise closing all short positions. If EUR/USD rises during the US session and bears show no energy at 1.0761, the bulls will regain the upper hand. In this case, the euro is likely to continue its growth next week. It is better to open short positions after a false breakout of 1.0805. You can sell EUR/USD immediately at a bounce from 1.0853 or even a high of 1.0894, keeping in mind a downward intraday correction of 30-35 pips.
COT report
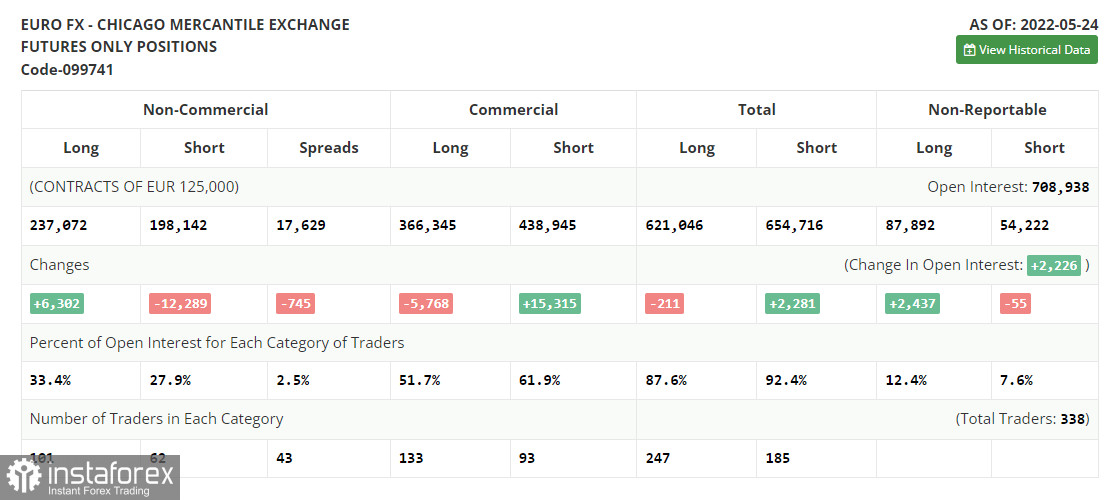
The COT report (Commitment of Traders) for May 24 logged a further increase in long positions and a contraction in short ones. Traders continued to open long positions amid expectations of more aggressive measures by the European Central Bank. Last week, the euro advanced significantly even though ECB policymakers made only a few hawkish statements. Now, the regulator is expected to raise the key rate by a quarter-point in July this year, followed by rate hikes in September and in December. The benchmark rate could be lifted to 0.25% by the end of the year. Some experts anticipate more aggressive measures from the ECB if inflation soars to 7.7% in May. The watchdog may hike the key rate in September and December to 0.5% from the current zero level. The COT report revealed that the number of long non-commercial positions rose by 6,302 to 237,072 from 230,770. The number of short non-commercial positions declined by 12 289 to 198,142 from 210,431. Notably, the weaker euro is more attractive to traders. Last week, the total non-commercial net position grew to 38,930 against 20,339 a week earlier. The weekly closing price edged higher to 1.0734 against 1.0556.
Signals of technical indicators
Moving averages
EUR/USD is trading near 30- and 50-period moving averages, which indicates market uncertainty.
Remark. The author is analyzing the period and prices of moving averages on the 1-hour chart. So, it differs from the common definition of classic daily moving averages on the daily chart.
Bollinger Bands
In case of a decline, the lower border at 1.0714 will act as support. In case of a rise, the upper border at 1.0761 will act asresistance.
Definitions of technical indicators
- Moving average recognizes an ongoing trend through leveling out volatility and market noise. A 50-period moving average is plotted yellow on the chart.
- Moving average identifies an ongoing trend through leveling out volatility and market noise. A 30-period moving average is displayed as the green line.
- MACD indicator represents a relationship between two moving averages that is a ratio of Moving Average Convergence/Divergence. The MACD is calculated by subtracting the 26-period Exponential Moving Average (EMA) from the 12-period EMA. A 9-day EMA of the MACD called the "signal line".
- Bollinger Bands is a momentum indicator. The upper and lower bands are typically 2 standard deviations +/- from a 20-day simple moving average.
- Non-commercial traders - speculators such as retail traders, hedge funds and large institutions who use the futures market for speculative purposes and meet certain requirements.
- Non-commercial long positions represent the total long open position of non-commercial traders.
- Non-commercial short positions represent the total short open position of non-commercial traders.
- The overall non-commercial net position balance is the difference between short and long positions of non-commercial traders.


