


Trend analysis
This week, GBP/USD will rise from 1.2485 (closing of the last weekly candle) to the 23.4% retracement level at 1.2648 (yellow dotted line), then move to the 38.2% retracement level at 1.2763 (red dotted line). Then after that, it will start to go down.
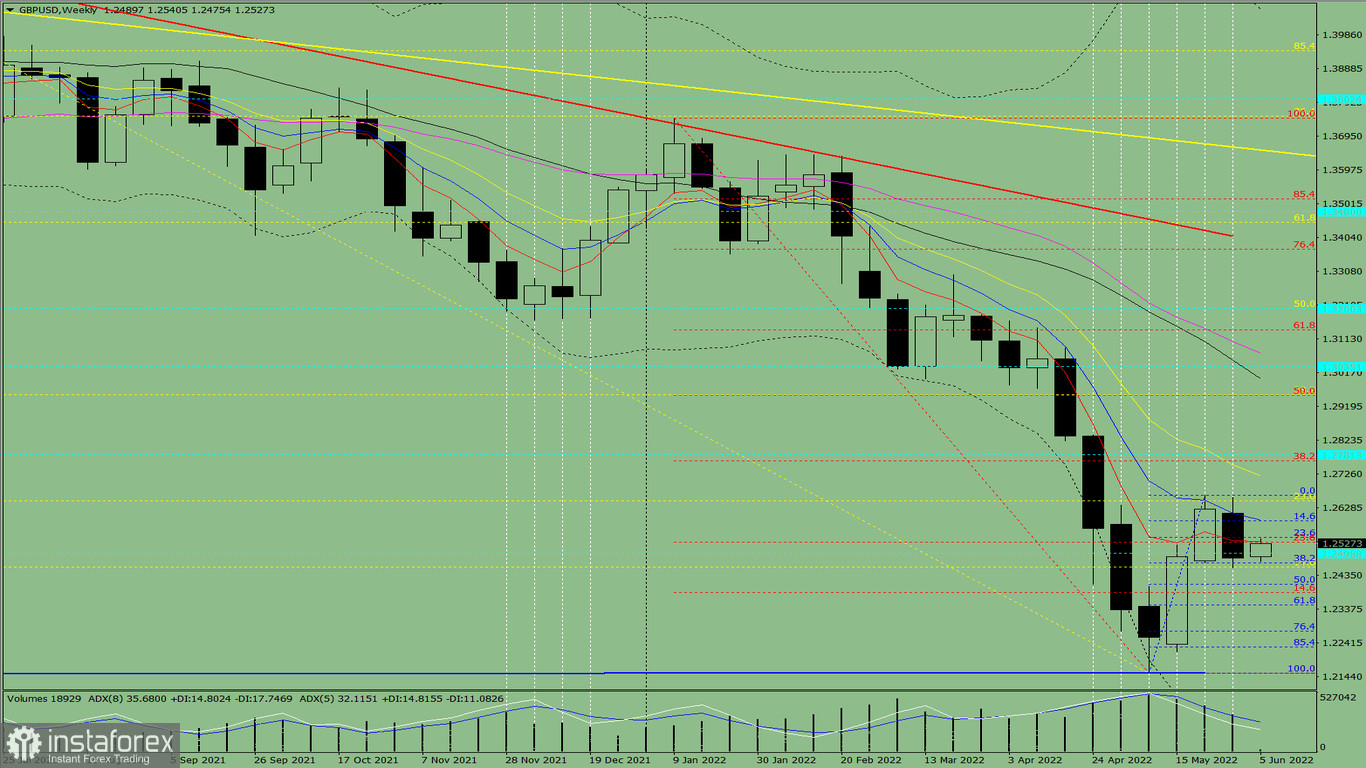
Fig. 1 (weekly chart)
Comprehensive analysis:
Indicator analysis - uptrend
Fibonacci levels - uptrend
Volumes - uptrend
Candlestick analysis - uptrend
Trend analysis - uptrend
Bollinger bands - uptrend
Monthly chart - uptrend
All this points to an upward movement in GBP/USD.
Conclusion: The pair will have an upward trend, with no first lower shadow on the weekly white candle (Monday - up) and no second upper shadow (Friday - up).
And during the week, the price will increase from 1.2485 (closing of the last weekly candle) to the 23.4% retracement level at 1.2648 (yellow dotted line), move to the 38.2% retracement level at 1.2763 (red dotted line), then go down.
Alternatively, the pair could climb from 1.2485 (closing of the last weekly candle) to the 23.6% retracement level at 1.2529 (red dotted line), then bounce down to the 50.0% retracement level at 1.2409 (blue dotted line). But upon reaching that level, the pair will most likely rise again.


