


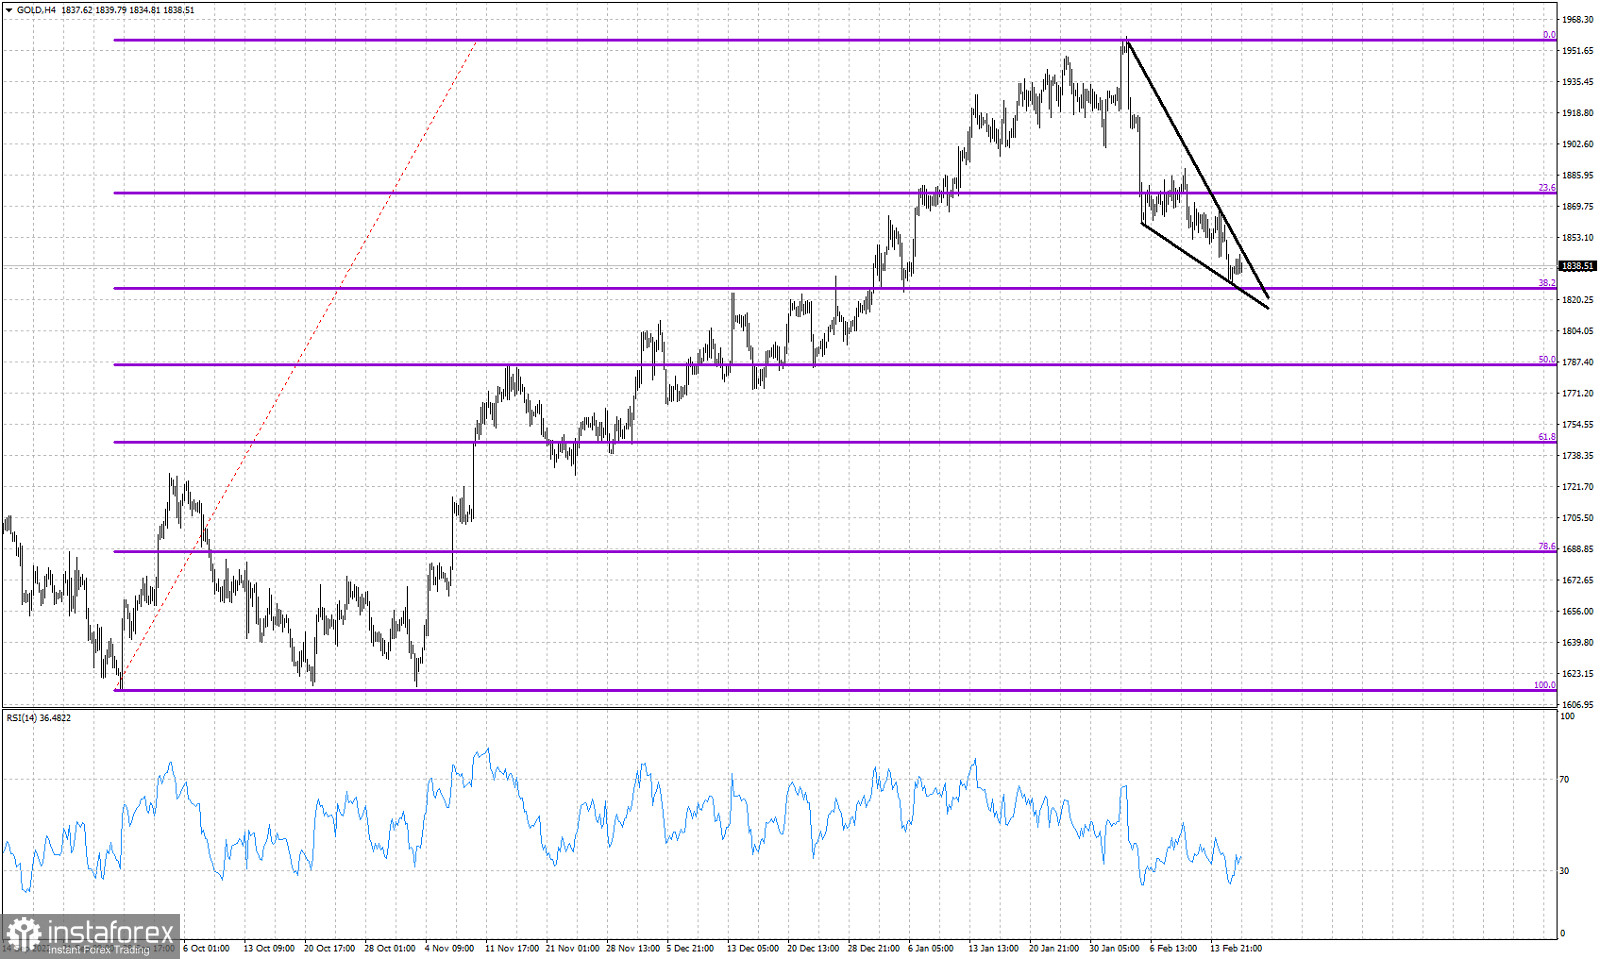
Violet lines- Fibonacci retracement levels
Black lines- wedge pattern
Gold price is trading around $1,838. Short-term trend remains bearish as price is making lower lows and lower highs. Price has formed a downward sloping wedge pattern and has stopped the decline it was right above the 38% Fibonacci retracement. Price so far is respecting the support by the 38% Fibonacci retracement level. The RSI has reached oversold levels twice and has also provided us with a bullish divergence. Resistance by the wedge pattern is at $1,845. A move higher towards $1,870 is very possible taking into consideration the wedge patter, the bullish divergence in the RSI and the fact that the 38% retracement support holds. Traders need to be very cautious as we might see a trend reversal soon.


