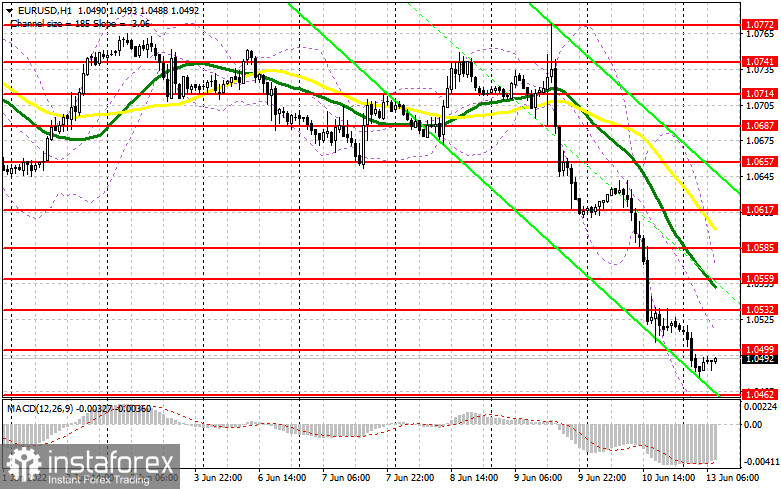
Let's turn to the M5 chart to get the picture of Friday trading. Several entry signals were made that day, with the focus on certain levels. A breakout and consolidation below 1.0602 with a bottom-top retest produced a sell signal along the trend formed after the ECB meeting. The quote plummeted in the first half of the day on Friday even before the US inflation report, bringing about 40 pips of a profit. The collapse of the euro after inflation data came unexpectedly. As a result, a sell signal was created after a breakout and a retest of 1.0559 from bottom to top. Eventually, the pair tumbled below 1.0535 and tested 1.0520, bringing about 40 pips of a profit. A false breakout at 1.0535 turned out to be unsuccessful. By the middle of the North American session, bears regained control over the mark. An additional sell entry point was made after a bottom-top test of this level. However, a clear downward move was seen during today's morning trading.

When to go long on EUR/USD:
Inflation in the US kept soaring in May and annually, missing all market forecasts, which boosted demand for the dollar and gave hopes that the Fed would continue hiking rates this fall. In this light, the greenback is becoming an even more attractive investment instrument. Due to the lack of any macro reports today, the euro is unlikely to find support. Therefore, it would be wiser to trade with the trend. Bulls will try to defend the key level of 1.0462, where traders will once again try to touch the bottom. With the price moving down, a buy signal will be made should a false breakout form at 1.0462 at the time of the MACD divergence. In such a case, the quote will try to get back to the intermediate resistance of 1.0499, build last Friday. Bears' stop orders will trigger if the price breaks through the range and test it from top to bottom. This will create a buy signal, and the quote may then retrace up to 1.0532. Bearish MAs are passing slightly above the mark and will limit the pair's growth potential. A more distant target stands at 1.0559, where profit taking should be considered. Should EUR/USD continue falling with no bullish activity at 1.0462, pressure on the euro will increase. The pair will go down to 1.0423 if a row of bullish stop orders triggers. Therefore, it would be wiser to go long after a false breakout only. Likewise, long positions on EUR/USD could be opened on a bounce off 1.0391 or 1.0353, allowing a 30-35 pips upward correction intraday.
When to go short on EUR/USD:
Bears extended the downward trend. Today, the market is likely to stay bearish in spite of the possibility of an upward correction. Should the pair rise in the first half of the day, a sell signal will be generated after a false breakout at 1.0499 only. If so, the price will try to reach support at 1.0462. An additional sell signal will be made in case of a breakout and consolidation below this range as well as its bottom-top retest. A series of bullish top orders may trigger and the price will head towards 1.0423. If the quote breaks and consolidates below 1.0423. Targets will stand at 1.0391 and 1.0353, where long positions should be all closed. If EUR/USD goes up during the European session and there is no bearish activity at 1.0499, selling could be considered after a false breakout at 1.0532. The bearish trend is likely to extend after a false breakout. Short positions on EUR/USD could also be opened on a bounce off the 1.0559 high or 1.0585, allowing a 30-35 downward correction intraday.

Commitments of Traders:
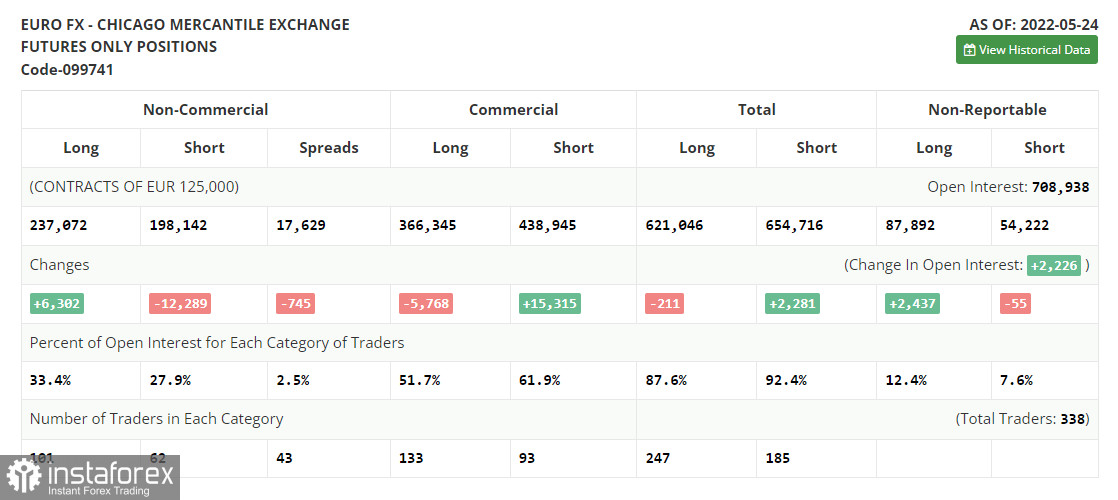
The Commitments of Traders report for May 24 logged a rise in long positions and a decrease in short ones. Traders kept going long on expectations of an aggressive ECB. The European regulator is now expected to raise the deposit rate by a quarter-point as early as July this year and then hike it in September and December, bringing it to 0.25% by the end of the year. Some experts say the ECB will have to act more aggressively. A lot will depend on the May inflation rate in the eurozone scheduled for release this week. Inflation is expected to soar to as much as 7.7% y/y. If so, pressure on ECB policymakers will mount. The key interest rate could be increased to 0.5% in September and December from the current 0.0% rate. According to the COT report, long non-commercial positions rose by 6,302 to 230,770 from 237,072. Short non-commercial positions dropped by -12,289 to 210,431 from 198,142. Amid a low exchange rate of the euro, demand for the currency is increasing, which is confirmed by a rise in long positions. In a week, non-commercial net positions increased to 38,930 from 20,339. The weekly closing price practically did not change – 1.0734 versus 1.0556.

Indicator signals:
Moving averages
Trading is carried out below the 30-day and 50-day moving averages, indicating a possible bearish move of the euro in the short term.
Note: The period and prices of moving averages are viewed by the author on the hourly chart and differ from the general definition of classic daily moving averages on the daily chart.
Bollinger Bands
The lower band at 1.0462 stands as support. Resistance is seen at 1.0559 in line with the upper band.
Indicator description:
- Moving average (MA) determines the current trend by smoothing volatility and noise. Period 50. Colored yellow on the chart.
- Moving average (MA) determines the current trend by smoothing volatility and noise. Period 30. Colored green on the chart.
- Moving Average Convergence/Divergence (MACD). Fast EMA 12. Slow EMA 26. SMA 9.
- Bollinger Bands. Period 20
- Non-commercial traders are speculators such as individual traders, hedge funds, and large institutions who use the futures market for speculative purposes and meet certain requirements.
- Long non-commercial positions are the total long position of non-commercial traders.
- Non-commercial short positions are the total short position of non-commercial traders.
- Total non-commercial net position is the difference between short and long positions of non-commercial traders.


