


GBP/USD 5M
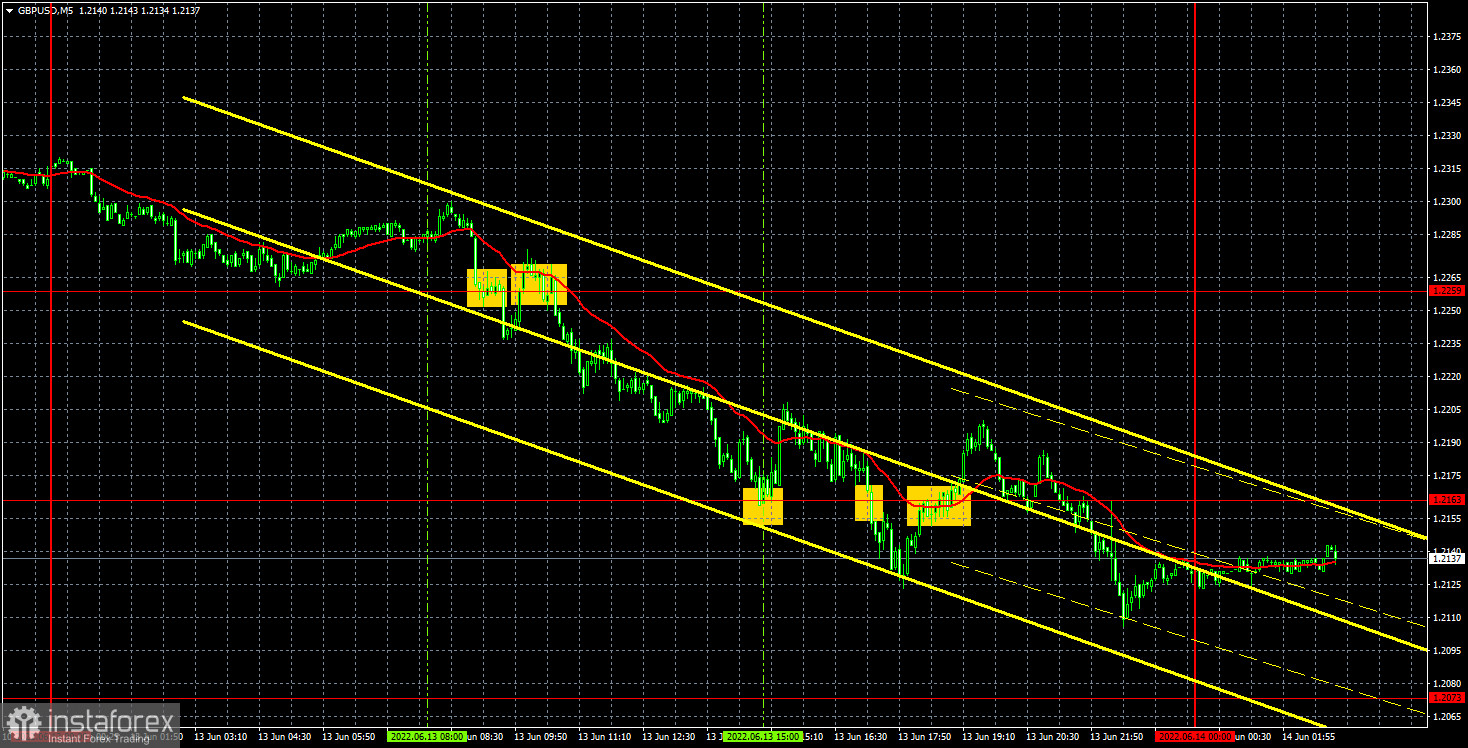
The GBP/USD currency pair also continued to fall on Monday. Moreover, it managed to fall by as much as 200 points in a day. On Monday! With an almost empty calendar of events! It should be noted right away that the British currency still had formal grounds for falling. In the morning, Britain published a report on GDP for the month of April, which turned out to be worse than expected. However, when was the last time a regular monthly GDP report caused a 200-point drop? Moreover, the pound started to fall long before the publication, even at night! A report on industrial production was also released, which also turned out to be weaker than forecasts. But these reports are generally extremely rarely worked out by the market. In general, it is formally possible to attribute the pound's collapse on Monday to weak statistics from Britain, but in fact this is not the case. The pound is approaching its 2-year lows and also seems to have resumed its downward trend.
Yesterday's trading signals for the pound were even worse than for the euro. The pair tried to roll back upwards several times a day, and each time these rollbacks occurred near important extreme levels, which resulted in forming false signals. In total, five signals are marked in the chart above. The first, third, fourth and fifth turned out to be false. It's good that it was possible to set Stop Loss to breakeven on the last three signals, and the last signal should not have been worked out at all, since by that time two false signals had already formed near the level of 1.2163. Thus, the first short position made a loss, while the second short made a profit. As a result, traders could end the day at zero or a small profit.
COT report:
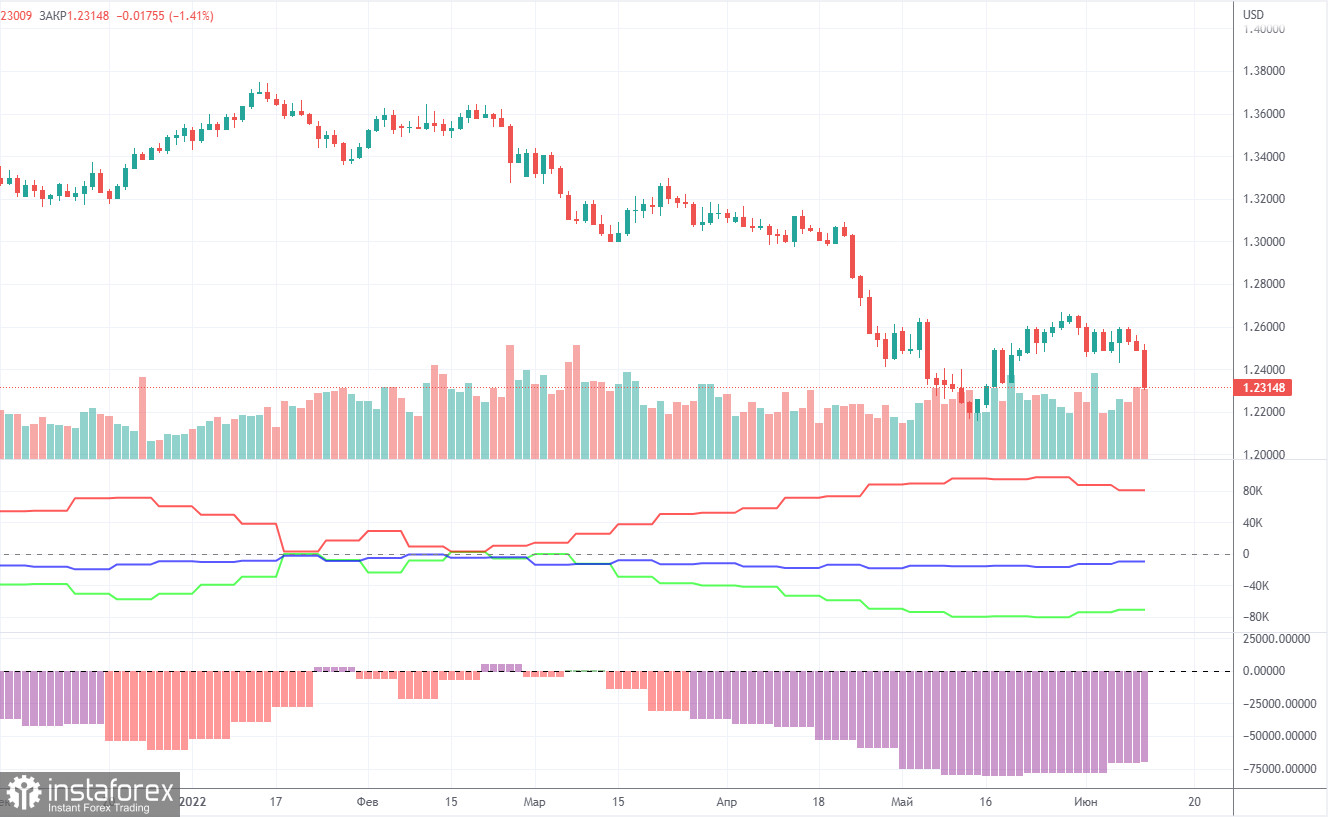
The latest Commitment of Traders (COT) report on the British pound showed insignificant changes. The non-commercial group opened 3,800 long positions and 500 shorts during the week. Thus, the net position of non-commercial traders increased by 3,300. However, the mood of major players still remains "pronounced bearish". And the pound, despite the growth of the net position, still resumed the fall. The net position has been falling for three months, which is perfectly visualized by the green line of the first indicator in the chart above or the histogram of the second indicator. Therefore, two increases in this indicator are unlikely to unambiguously indicate the end of the downward trend for the pound. The non-commercial group has a total of 105,000 shorts open and only 34,000 longs. Thus, the difference between these numbers is more than three times. We note that in the pound's case, the COT report data very accurately reflects what is happening in the market: the mood of traders is "very bearish", and the pound has been falling against the US dollar for a long time. In the past few weeks, the pound has shown growth, but even in the chart for this paragraph (daily timeframe), this movement looks very weak. Since in the pound's case, the COT report data reflects the real picture of things, we note that a strong divergence of the red and green lines of the first indicator often means the end of the trend. Therefore, now we can formally count on a new upward trend. However, weak geopolitical, fundamental and macroeconomic backgrounds for European currencies still put pressure on these currencies.
We recommend to familiarize yourself with:
Overview of the EUR/USD pair. June 14. The euro did not even think to stop in its fall.
Overview of the GBP/USD pair. June 14. The British economy began to shrink. The pound is falling into the abyss.
Forecast and trading signals for EUR/USD on June 14. Detailed analysis of the movement of the pair and trading transactions.
GBP/USD 1H
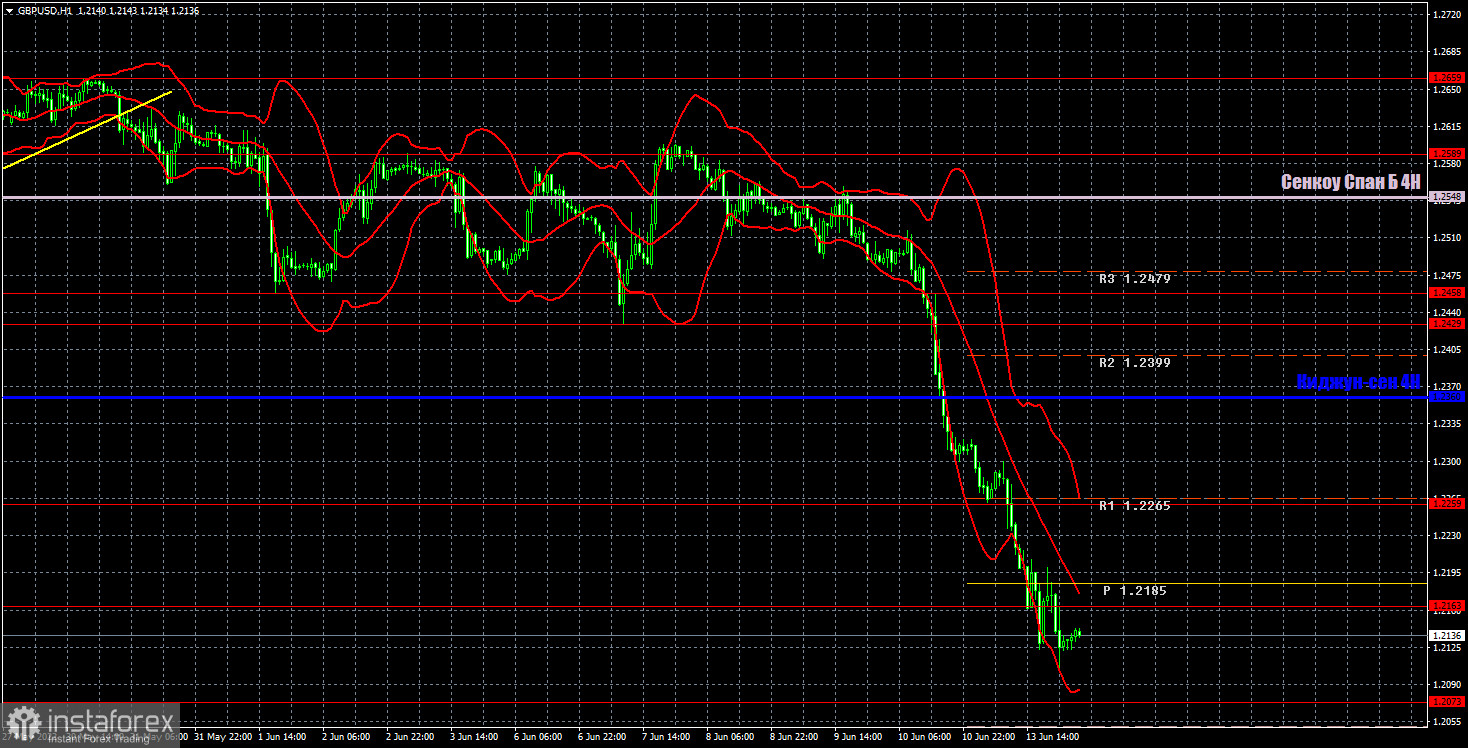
No comments are particularly needed on the hourly timeframe. The pair resumed its fall, and not just a fall, but actually a collapse. There were no corrections on Monday, so it will be expected on Tuesday, and on Wednesday and Thursday two major events will take place - meetings of the Bank of England and the Federal Reserve... Today, we highlight the following important levels: 1.2073, 1.2163 , 1.2259, 1.2429, 1.2458, 1.2589. Senkou Span B (1.2548) and Kijun-sen (1.2360) lines can also be sources of signals. Signals can be "rebounds" and "breakthroughs" of these levels and lines. The Stop Loss level is recommended to be set to breakeven when the price passes in the right direction by 20 points. Ichimoku indicator lines can move during the day, which should be taken into account when determining trading signals. The chart also contains support and resistance levels that can be used to take profits on trades. There are no interesting events scheduled for Tuesday in the UK and the US. All the most interesting (at least two central meetings will be held later in the week). However, even the beginning of the week for the pound did not turn out to be calm and measured. Scary to think what will happen next...
Explanations for the chart:
Support and Resistance Levels are the levels that serve as targets when buying or selling the pair. You can place Take Profit near these levels.
Kijun-sen and Senkou Span B lines are lines of the Ichimoku indicator transferred to the hourly timeframe from the 4-hour one.
Support and resistance areas are areas from which the price has repeatedly rebounded off.
Yellow lines are trend lines, trend channels and any other technical patterns.
Indicator 1 on the COT charts is the size of the net position of each category of traders.
Indicator 2 on the COT charts is the size of the net position for the non-commercial group.


