


Economic calendar on June 13
Industrial production in the UK stayed at the same level although analysts predicted a rise to 1.2% from 0.7%. This was another factor to weigh on the pound sterling.
Speculations that the Fed will raise the rate by more than 0.5% at its next meeting serve as the main driver for the US dollar. Markets expect the regulator to introduce a rate hike of 0.75% which boosts the demand for the greenback.
Analyzing charts on June 13
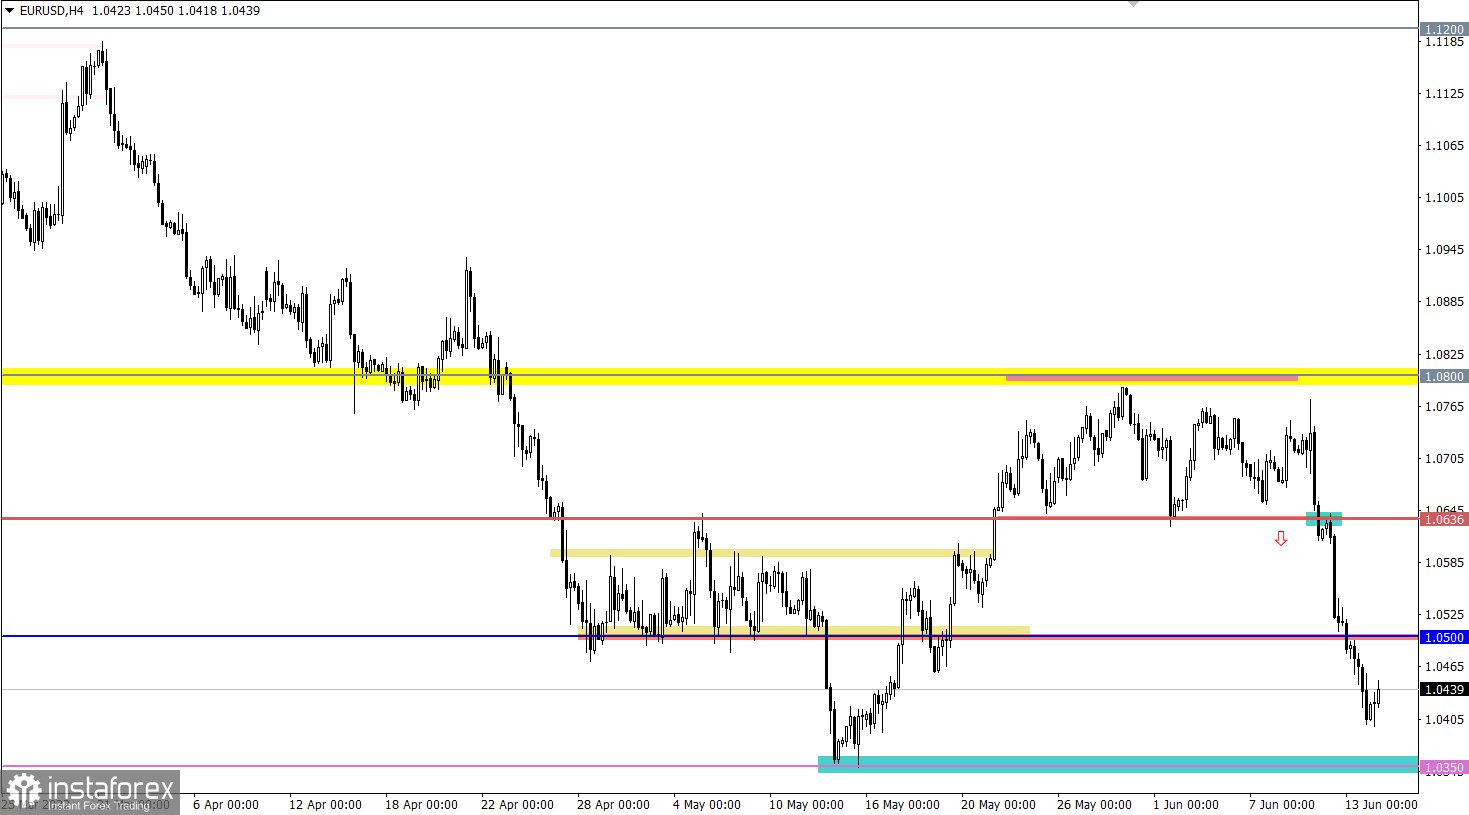
The EUR/USD pair accelerated the pace of decline and broke through some key technical levels. This resulted in the euro losing 300 points over the past three sessions. The US dollar is recovering against the recent correction at the rate of 89%.
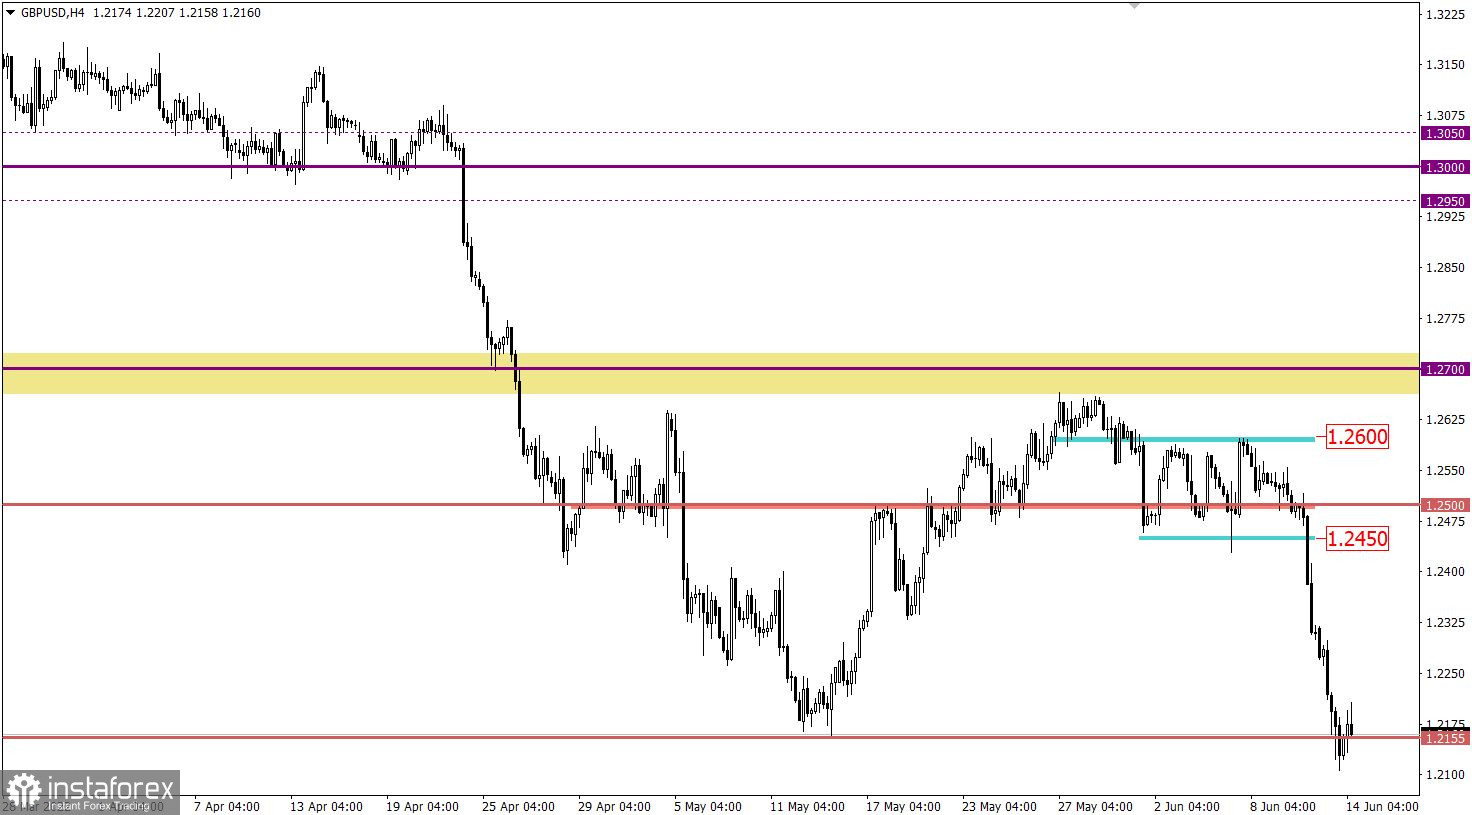
The GBP/USD pair is moving lower following momentum and has already fallen by 400 points. As a result, the price broke through the local low of May and extended the downtrend.
Economic calendar on June 14
At the start of the European session, the employment data was published in the UK. The data turned out to be below the forecast as the unemployment rate went up to 3.8% from 3.7% versus the estimated rate of 3.6%. The number of jobs increased by 177,000, while jobless claims declined less than expected.
Overall, the data on the labor market in the UK is not so encouraging.
EUR/USD trading plan on June 14
At the moment, we can observe how the price is approaching the start of the recent correction. This may result in a short-term reduction in the volume of short positions and a subsequent pullback.
The volume of short positions may later increase when the price settles below the level of 1.0350 at least on the 4-hour chart.
GBP/USD trading plan on June 14 At the moment, we can observe a technical pullback that returned the quote above the 1.2155 mark. The bearish sentiment still prevails in the market. In case the price goes back below the level of 1.2155, the decline may continue.
On the charts
The candlestick chart shows white and black rectangles with lines above and below them. In a detailed analysis of a particular candlestick, you can see its main features on every given time frame: opening price, closing price, high and low.
Horizontal levels are lines near which the price may either stop or reverse. These levels are called support and resistance.
Circles and rectangles are the examples marked on the chart where the price has previously reversed. Horizontal lines that may potentially put pressure on the quote are highlighted on the chart.
The up/down arrows show the possible direction of the price.


