


Analysis of Tuesday's deals:
30M chart of the EUR/USD pair
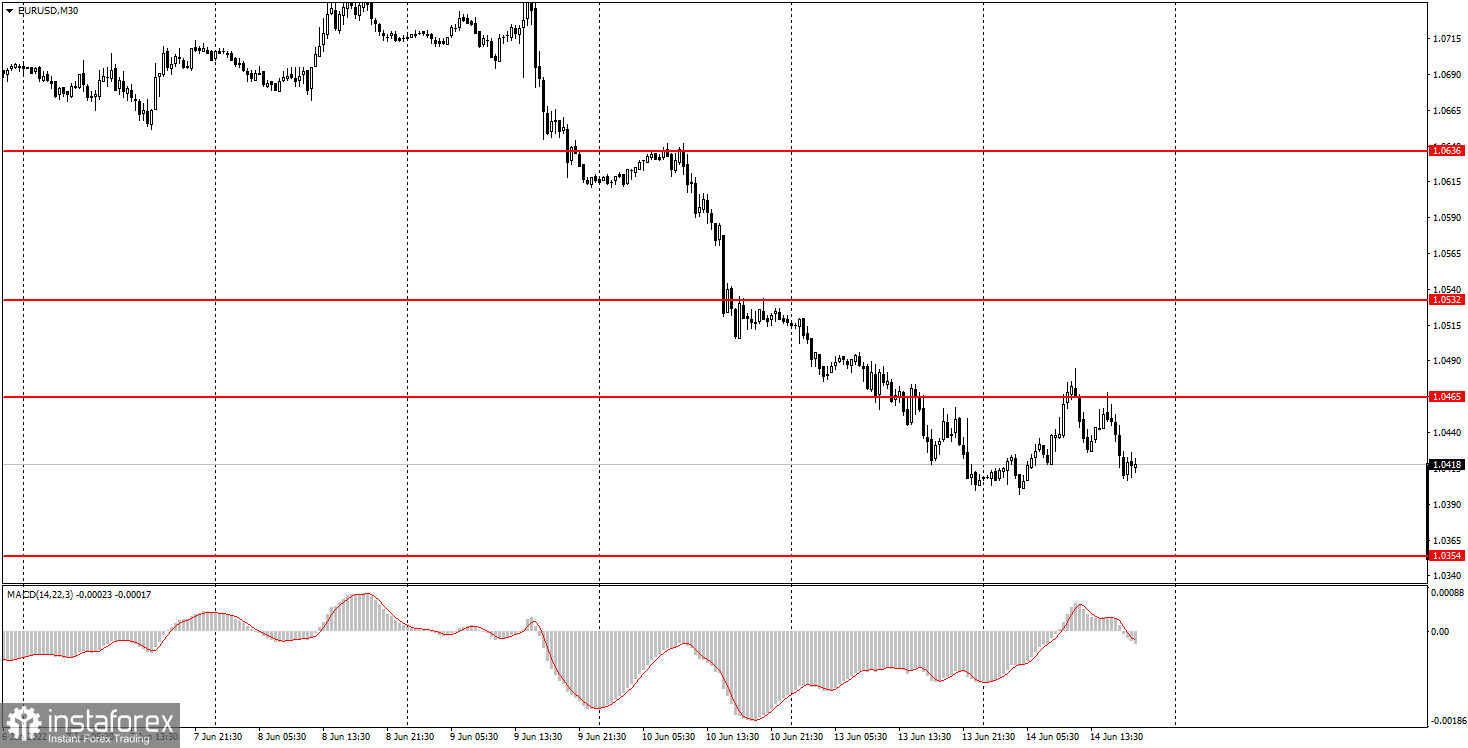
The EUR/USD currency pair tried to start an upward correction on Tuesday after a three-day fall, which looks more like a collapse. However, before hitting the first level on its way, the euro gave in and retreated from it. We are talking about the level of 1.0465. Thus, by the end of the day, the pair's quotes were again near local lows and near 20-year lows. Therefore, we can make an almost unambiguous conclusion - the downward trend continues and there is no reason to believe that it will end in the near future. There is still no trend line, since there are not even two points through which it could be formed - such a strong downward movement. There were no macroeconomic statistics on Tuesday as well as fundamental events. However, the results of the two-day Federal Reserve meeting will be announced on Wednesday, which may provoke a serious outburst of emotions in the currency market. Given how much the euro has fallen over the past few days, we are not even sure that the market will react with new long positions on the dollar. Even if the Fed raises rates by 0.75%. Thus, you should be as careful as possible with opening any transactions.
5M chart of the EUR/USD pair
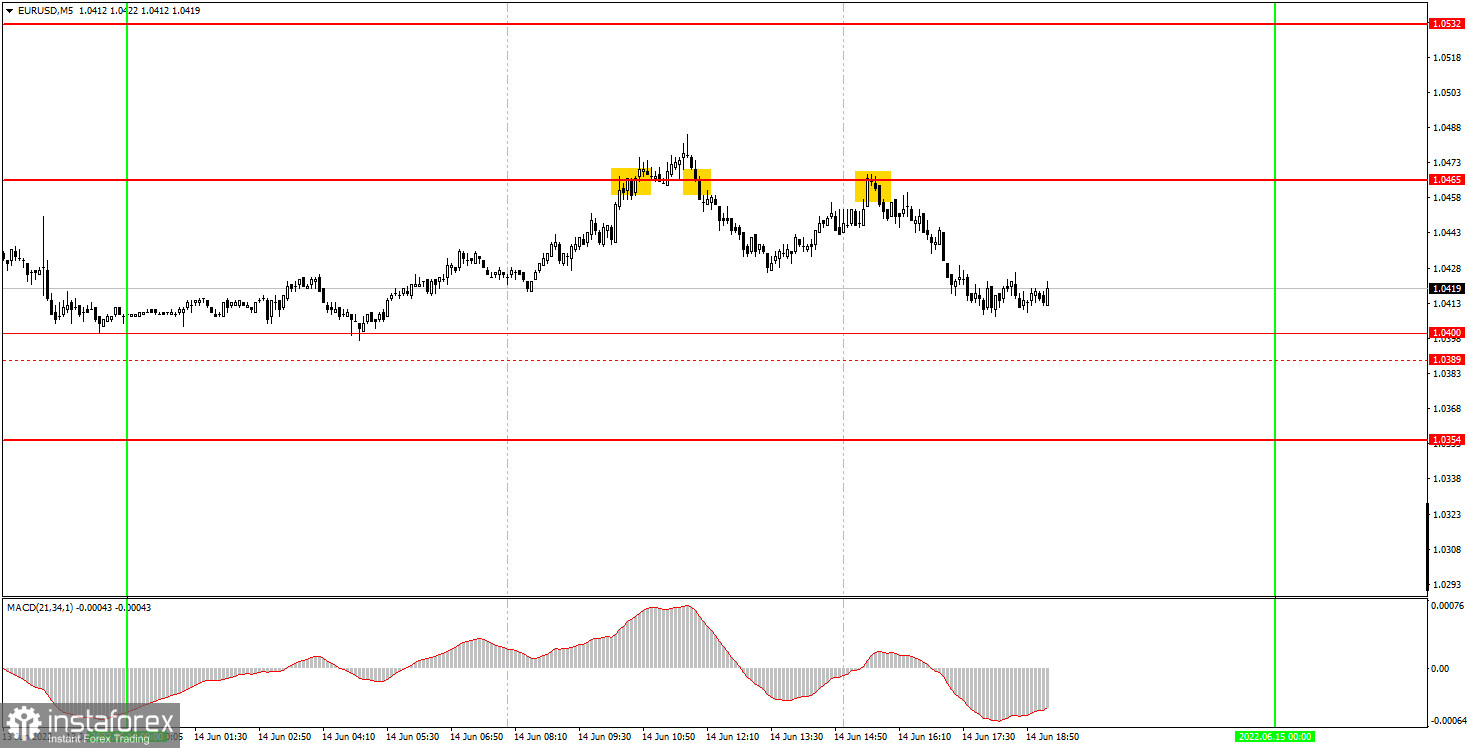
The technical picture looks pretty average on the 5-minute timeframe. Like the day before, the movement seemed to be quite good, but the pair behaved very strangely near the key levels, sometimes ignoring the levels, sometimes forming false signals around them. Thus, it was not possible to earn a lot on Tuesday. The first buy signal turned out to be false, as the pair settled above the 1.0465 level, but failed to continue its upward movement. Novice traders failed to even place a Stop Loss on a long position, and the deal closed at a loss when the price dropped below the level of 1.0465, forming a sell signal along the way. It also had to be worked out and it was already better than the previous one, but the price still did not reach the nearest target level of 1.0389 (the level of 1.0400 is a new level). The third and last sell signal turned out to be the strongest, but it was not worth working on it, since at that time two false signals had already been formed near this level. In general, traders could get a small profit only on the second transaction if they closed it manually.
How to trade on Wednesday:
The pair continues a fairly strong downward movement without a trend line on the 30-minute timeframe. Thus, short positions on the pair are currently relevant, but traders have very few reference points, since there are, in principle, very few levels at current price values. Recall that now the price is trading near its 20-year lows. On the 5-minute TF, it is recommended to trade at the levels of 1.0354, 1.0400, 1.0465, 1.0532, 1.0564. When passing 15 points in the right direction, you should set Stop Loss to breakeven. The European Union will publish a report on industrial production, and the US will release a report on retail sales. Naturally, both of these reports fade against the background of the event, which is scheduled for the evening, and which, perhaps, is already having a strong impact on the movement of the EUR/USD pair. We are talking about the US central bank meeting, its results and a press conference with Fed Chairman Jerome Powell.
Basic rules of the trading system:
1) The signal strength is calculated by the time it took to form the signal (bounce or overcome the level). The less time it took, the stronger the signal.
2) If two or more deals were opened near a certain level based on false signals (which did not trigger Take Profit or the nearest target level), then all subsequent signals from this level should be ignored.
3) In a flat, any pair can form a lot of false signals or not form them at all. But in any case, at the first signs of a flat, it is better to stop trading.
4) Trade deals are opened in the time period between the beginning of the European session and until the middle of the American one, when all deals must be closed manually.
5) On the 30-minute TF, using signals from the MACD indicator, you can trade only if there is good volatility and a trend, which is confirmed by a trend line or a trend channel.
6) If two levels are located too close to each other (from 5 to 15 points), then they should be considered as an area of support or resistance.
On the chart:
Support and Resistance Levels are the Levels that serve as targets when buying or selling the pair. You can place Take Profit near these levels.
Red lines are the channels or trend lines that display the current trend and show in which direction it is better to trade now.
The MACD indicator (14,22,3) consists of a histogram and a signal line. When they cross, this is a signal to enter the market. It is recommended to use this indicator in combination with trend lines (channels and trend lines).
Important speeches and reports (always contained in the news calendar) can greatly influence the movement of a currency pair. Therefore, during their exit, it is recommended to trade as carefully as possible or exit the market in order to avoid a sharp price reversal against the previous movement.
Beginners on Forex should remember that not every single trade has to be profitable. The development of a clear strategy and money management are the key to success in trading over a long period of time.


