


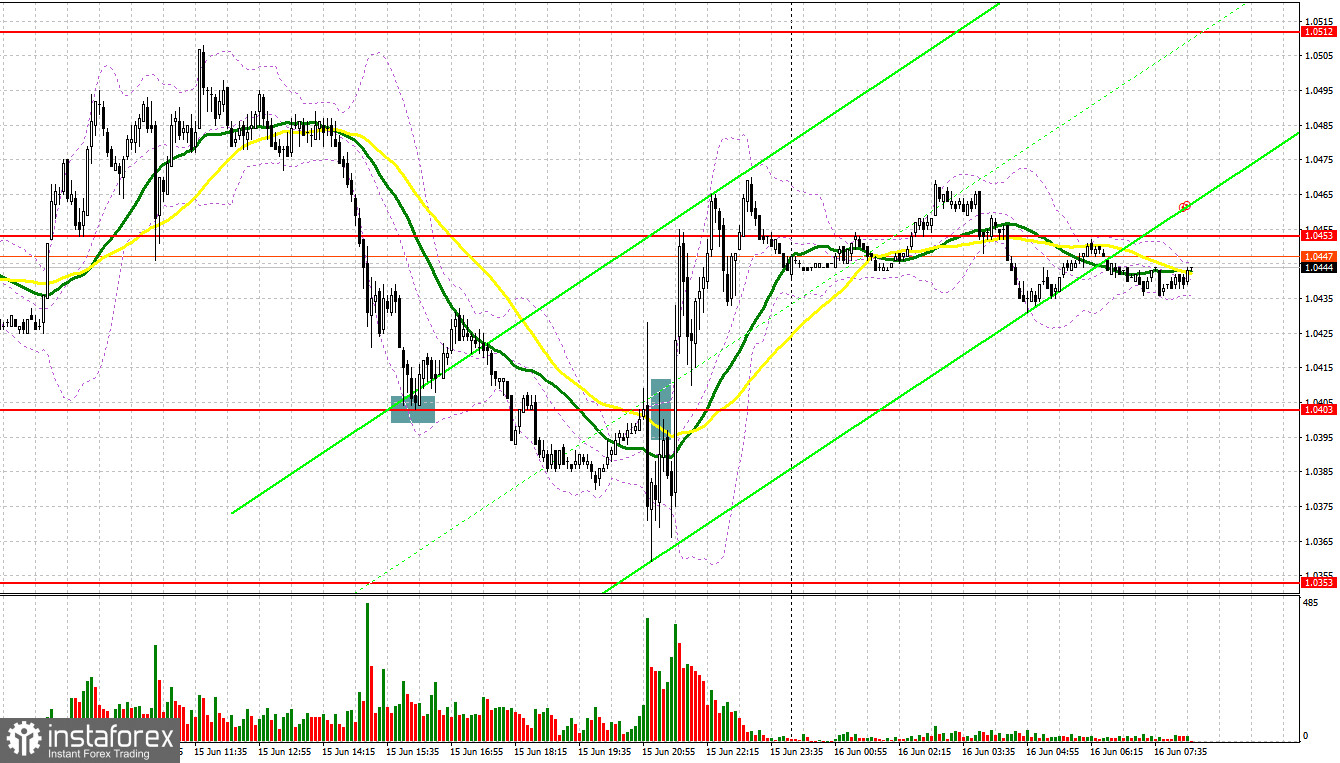
Yesterday, traders received several signals to enter the market. Let's take a look at the 5-minute chart to clear up the market situation. During the European session, there were no good signals to enter the market. However, the second part of the day was much more interesting. A decline and false break of 1.0403 before the publication of the Fed's decision led to a perfect buy signal. As a result, the euro added more than 30 pips, but then pressure on the asset returned. Just after the meeting, the pair plummeted, whereas an upward test of 1.0403 led to a sell signal. As a result, the pair lost about 30 pips. After that, the euro started actively gaining in value.
Conditions for opening long positions on EUR/USD:
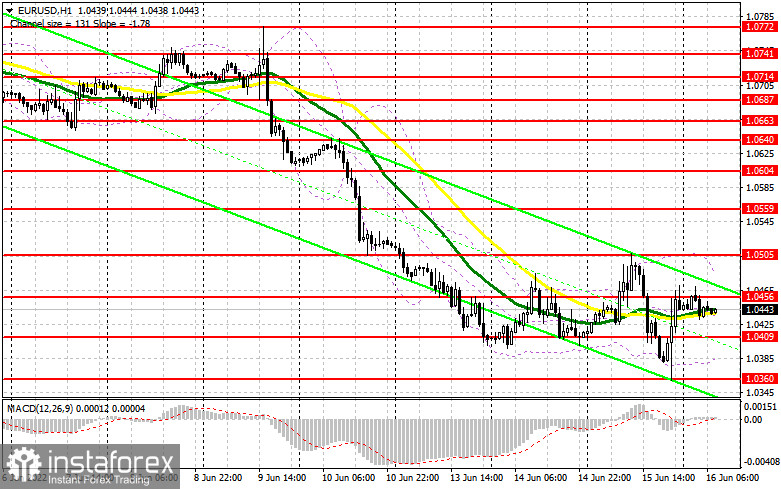
Yesterday, the US Fed raised the benchmark rate by 0.75% as expected. Since traders priced in the decision long ago, it did not cause any significant changes in the market. Thus, the US dollar failed to consolidate at new record highs against the euro. Today, a lot depends on bulls' ability to protect 1.0400. In the first part of the day, the eurozone is going to disclose its wages data as well as the Eurogroup meeting will take place. It will be quite interesting to listen to an interview with ECB representative Fabio Panetta, who will surely emphasize the necessity of a more aggressive policy, which can strengthen the euro's position. That is why bulls should primarily protect the nearest level of 1.0409, where traders are trying to find a bottom. In case of a decline, only a false break of this level and strong data from the eurozone will give a long signal with the target at the intermediate resistance level of 1.0456. A break and a downward test of this level may affect sellers' stop orders, thus giving a new buy signal with a farther target at 1.0505. Thus, trading is performed near the moving averages, which proves buyers' intention to gain control over the market. The next target is located at 1.0559, where it is recommended to lock in profits. If the euro/dollar pair drops and buyers fail to protect 1.0409, the currency may face serious obstacles. If stop orders are executed below this level, the pair will slump to the yearly low of 1.0360. That is why it will be better to go long after a false break. It is also possible to buy the asset from 1.0306 or lower – from 1.0255, expecting a rise of 30-35 pips.
Conditions for opening short positions on EUR/USD:
Sellers did their best to fix at the yearly lows, but that was not enough. If the pair rises in the first part of the day, only a false break of the intermediate resistance level of 1.456 will give a short signal with the target at the support level of 1.0409. A break and settlement below this level as well as weak data from the eurozone and an upward test may lead to an additional sell signal that may affect buyers' stop orders. In this case, the pair may slide to 1.0360. Today, traders should be very cautious when opening sell orders with the target below the local lows. The fact is that yesterday, bears failed to succeed even amid such an aggressive policy of the Fed. It is obvious that the euro is significantly oversold. Now, there are fewer traders who want to open short positions. A break and settlement below 1.0360, will push the price lower to 1.0306 and 1.0255, where it will be wise to leave the market. If the pair jumps during the European session and bears fail to protect 1.0456, it will be better to avoid short positions until the price hits 1.0505. A false break of this level will encourage bears. It is also possible to sell from the high of 1.0559 or higher – from 1.0604, expecting a drop of 30-35 pips.
COT report
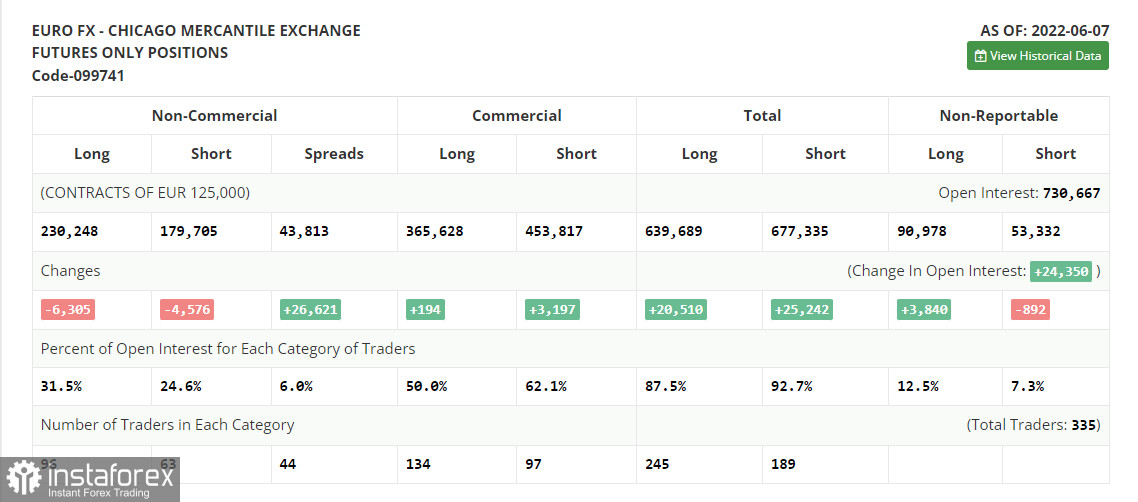
According to the COT report from June 7, the number of both long and short positions slumped. The fact is that most traders were very cautious expecting the ECB meeting. That is why market activity was very low. The time showed that it was a perfect idea to avoid trading. Last week, the ECB's representatives said that the regulator would raise the benchmark rate at the following meeting. However, even this announcement failed to prop up the euro. The US inflation data published on Friday caused a decline in risk assets, including the euro. A further trend of the euro/dollar pair depends on the Fed's decision on monetary policy and forecasts for the next few years. If the regulator's stance remains aggressive, the euro is likely to slide deeper to new yearly lows. The COT report unveiled that the number of long non-commercial positions declined by 6,305 to 230,248, while the number of short non-commercial positions dropped by 4,576 to 179,705. Although the euro is rather cheap, traders are not very interested in it. According to the week's results, the total non-commercial net position decreased to 50,543 against 52,272 a week earlier. The weekly closing price dropped to 1.0710 compared to 1.0742.
Signals of indicators:
Moving Averages
Trading is performed near 30- and 50-day moving averages, thus pointing to the sideways movement.
Note: The period and prices of moving averages are considered by the author on the one-hour chart that differs from the general definition of the classic daily moving averages on the daily chart.
Bollinger Bands
In case of a decline, the support level will be located at a lower indicator's limit at 1.0380. If the pair increases, the resistance level will be located at the higher limit of the indicator at 1.0480.
Description of indicators:- Moving average (moving average, determines the current trend by smoothing volatility and noise). The period is 50. It is marked in yellow on the chart.
- Moving average (moving average, determines the current trend by smoothing volatility and noise). The period is 30. It is marked in green on the graph.
- MACD indicator (Moving Average Convergence/Divergence - convergence/divergence of moving averages). A fast EMA period is 12. A slow EMA period is 26. The SMA period is 9.
- Bollinger Bands. The period is 20.
- Non-profit speculative traders are individual traders, hedge funds, and large institutions that use the futures market for speculative purposes and meet certain requirements.
- Long non-commercial positions is a total number of long positions opened by non-commercial traders.
- Short non-commercial positions is a total number of short positions opened by non-commercial traders.
- The total non-commercial net position is a difference in the number of short and long positions opened by non-commercial traders.


