


Analysis of Thursday's deals:
30M chart of the GBP/USD pair
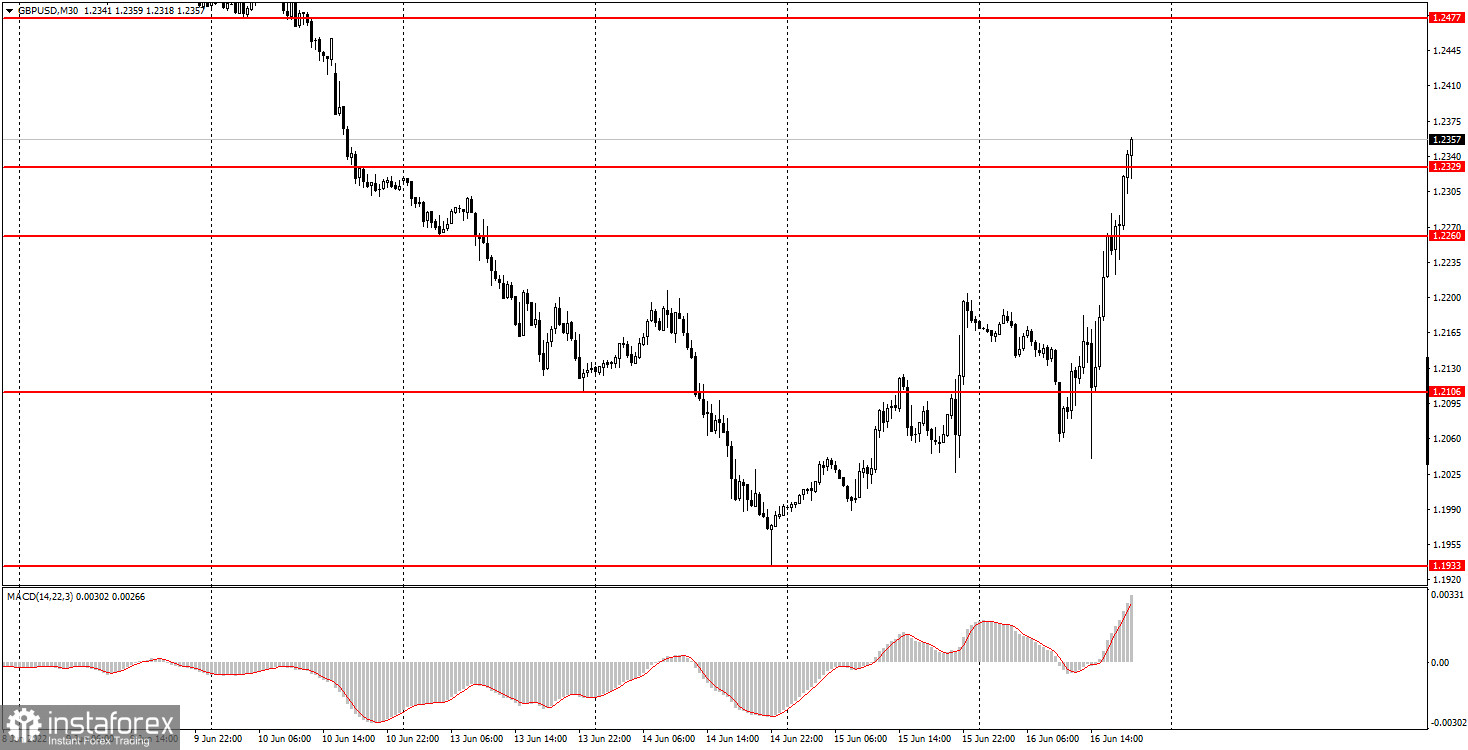
The GBP/USD pair showed the strongest volatility on Thursday. Moreover, the pair first traded with a strong decline, and then with an even stronger growth. The total volatility of the day was about 360 points, which happens several times a year. In principle, there is nothing surprising in this. In our last articles, we have already said that on Thursday traders will work out not only the results of the Bank of England meeting, but also the Federal Reserve meeting, the results of which were announced on Wednesday evening. Naturally, when two central banks raise rates, both keep a tough hawkish rhetoric, leading to strong moves. We also warned that it would be unrealistic to predict the pair's movement on Thursday. As a result, the pound has risen in price very much, but this does not make it possible to conclude that a long upward trend will now begin. A trend line may be formed in the near future, but it will also mean little. The pair has been trading "on emotions" for the last two days. Certain conclusions can already be drawn now, but first, the market needs to calm down and return to its normal course. As is already known, the BoE raised the rate by 0.25%, but we recall that the previous four rounds of rate hikes did not provoke the pound's growth, and the geopolitical situation remains very difficult for both European currencies.
5M chart of the GBP/USD pair
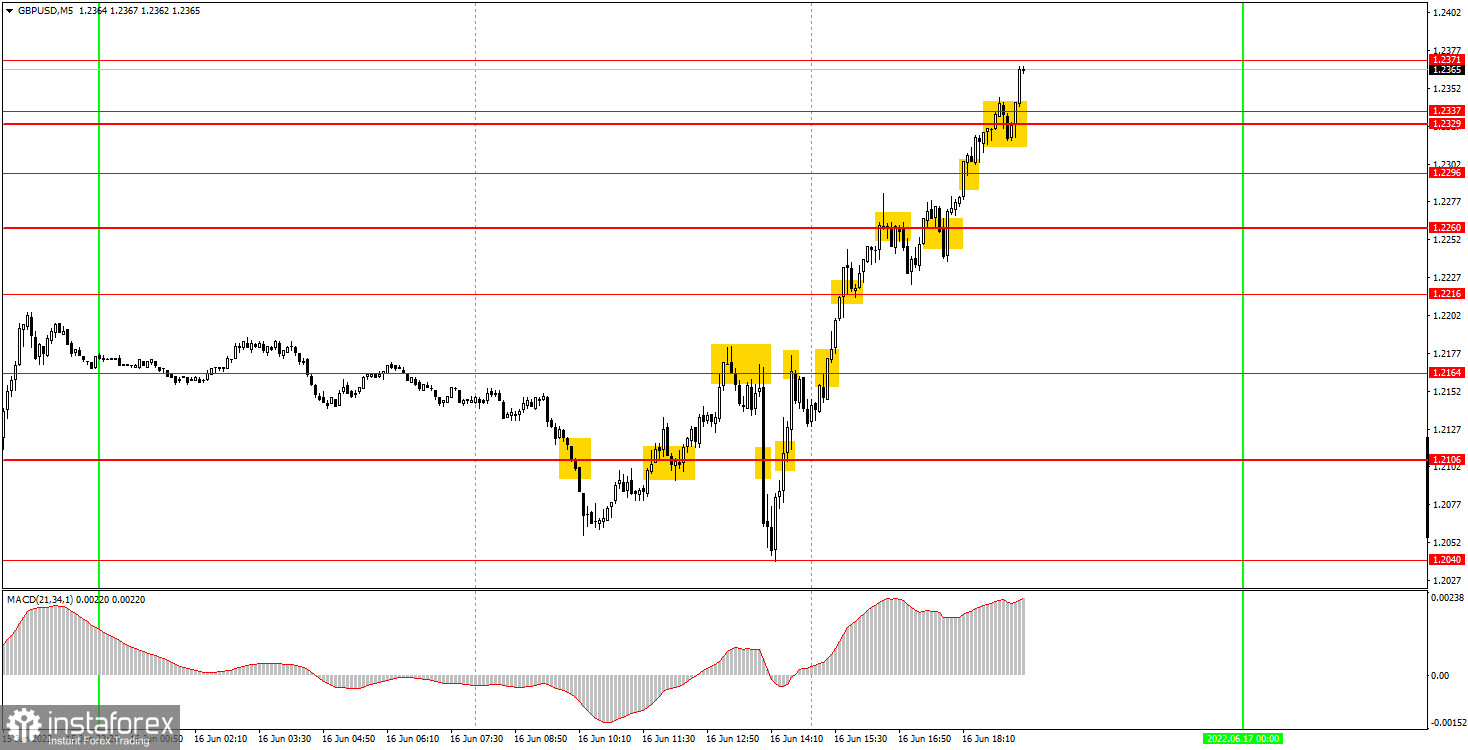
On the 5-minute timeframe, it doesn't even make much sense to consider trading signals that have formed during the day. On the movement of 360 points, 12 of them were formed. Moreover, frequent reversals and jerky movements were already observed in the first half of the day. Traders began to work out the results of the Fed meeting in the morning, as the Europeans were deprived of such an opportunity the day before. Thus, theoretically, novice players could try to work out the first two signals. The first one was closed by Stop Loss at breakeven, the second one brought a profit of about 30 points. Then there was the announcement of the results of the BoE meeting, so it was dangerous to open deals. As you can see, the pair first fell down in 5 minutes by 100 points, and then went up 360 points. Of course, it was possible to make money on such a trend movement, but it was too dangerous to open deals. A small profit is better than a loss.
How to trade on Friday:
The pound/dollar pair started to rise sharply on the 30-minute timeframe, but it's too early to talk about an upward trend now. After such a strong movement, a downward correction should follow, and after its completion, it will be necessary to look at where the pair will be. We do not rule out the possibility that the long-term downward trend will continue. On the 5-minute TF, it is recommended to trade at the levels 1.2216, 1.2260, 1.2296, 1.2329-1.2337, 1.2371, 1.2471-1.2477. When the price passes after opening a deal in the right direction for 20 points, Stop Loss should be set to breakeven. There are no major events scheduled for tomorrow in the UK. Meanwhile, Fed Chairman Jerome Powell will deliver a speech in the US, as well as a report on industrial production. The report can be neglected, since the market is now studying and working out clearly more important information. You can't expect much from Powell either, as he spoke literally on Wednesday evening and said everything that was necessary.
Basic rules of the trading system:
1) The signal strength is calculated by the time it took to form the signal (bounce or overcome the level). The less time it took, the stronger the signal.
2) If two or more deals were opened near a certain level based on false signals (which did not trigger Take Profit or the nearest target level), then all subsequent signals from this level should be ignored.
3) In a flat, any pair can form a lot of false signals or not form them at all. But in any case, at the first signs of a flat, it is better to stop trading.
4) Trade deals are opened in the time period between the beginning of the European session and until the middle of the American one, when all deals must be closed manually.
5) On the 30-minute TF, using signals from the MACD indicator, you can trade only if there is good volatility and a trend, which is confirmed by a trend line or a trend channel.
6) If two levels are located too close to each other (from 5 to 15 points), then they should be considered as an area of support or resistance.
On the chart:
Support and Resistance Levels are the Levels that serve as targets when buying or selling the pair. You can place Take Profit near these levels.
Red lines are the channels or trend lines that display the current trend and show in which direction it is better to trade now.
The MACD indicator (14,22,3) consists of a histogram and a signal line. When they cross, this is a signal to enter the market. It is recommended to use this indicator in combination with trend lines (channels and trend lines).
Important speeches and reports (always contained in the news calendar) can greatly influence the movement of a currency pair. Therefore, during their exit, it is recommended to trade as carefully as possible or exit the market in order to avoid a sharp price reversal against the previous movement.
Beginners on Forex should remember that not every single trade has to be profitable. The development of a clear strategy and money management are the key to success in trading over a long period of time.


