


EUR/USD 5M
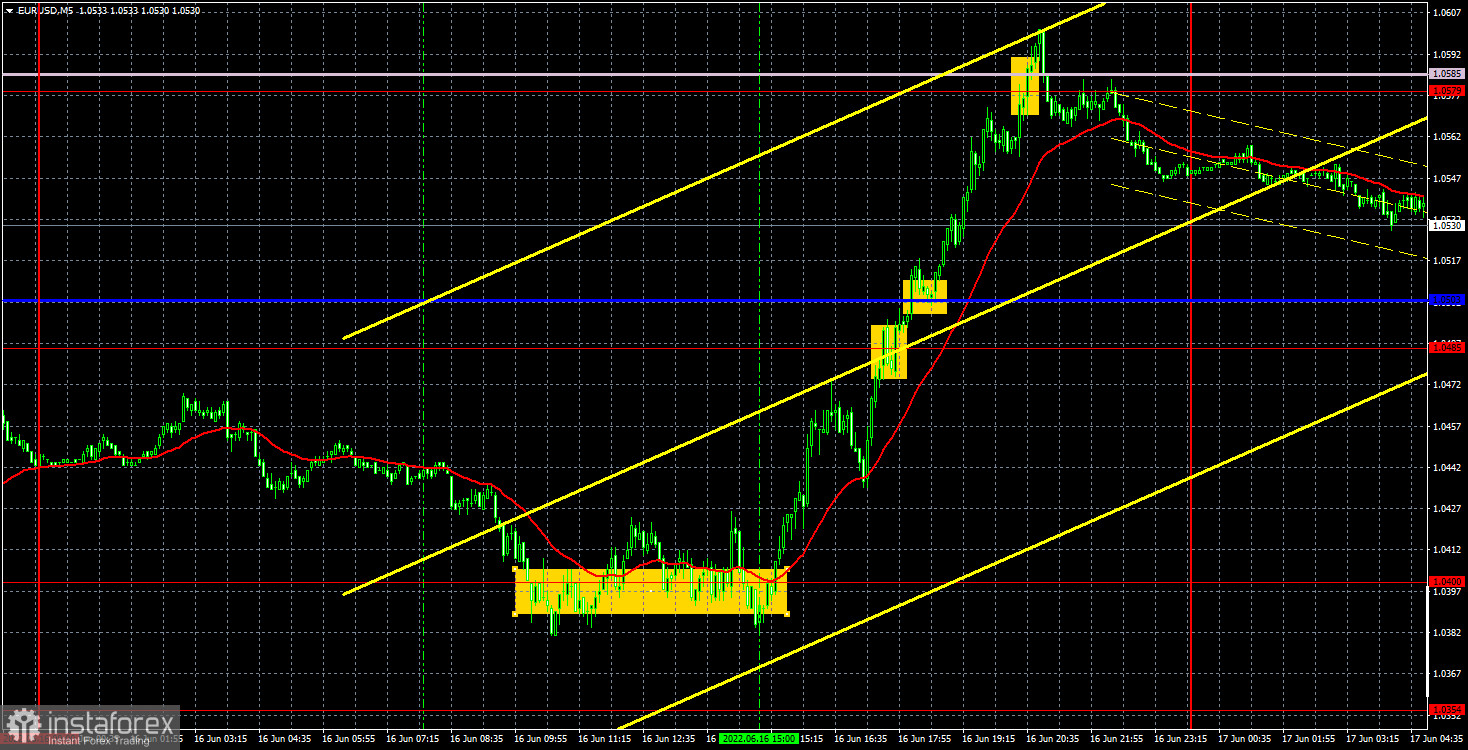
The EUR/USD pair showed the strongest growth on Thursday. Interestingly, neither the United States nor the European Union had any important events planned for yesterday, but this did not prevent the pair from passing 220 points, and the euro to grow by the same amount. A day earlier, we warned that the market could work out the results of the Federal Reserve meeting within at least 24 hours. This is due to the fact that the results are published late on Wednesday evening and neither the Americans nor the Europeans have enough time to work them out. So yesterday, with a 95% chance, we saw a genuine market reaction to a 0.75% rate hike and Fed Chairman Jerome Powell's promise to raise another 0.5-0.75% next month. The reaction is very strange, since the dollar did not grow, but rather fell very much. Nevertheless, we warned about this too: the market could work out the results of the meeting in advance, without even knowing them. All because no one doubted that the rate would be increased by a significant amount. Considering that the euro fell into the abyss a few days before the meeting, this option looks quite reasonable. The main question now is: what will happen next with the euro? It showed strong growth, but the global downward trend still remains relevant.
Despite the highest volatility, trading signals were very mixed. The price was mostly around the level of 1.0400 for almost the entire European session, having overcome it several times in both directions. Thus, traders could open two trades at this moment, which brought a loss of about 40 points. All subsequent signals near this level should not have been opened. After that, it was possible to work out another signal to buy about overcoming the critical line. You should have left the deal when the pair settled below the level of 1.0579. And this trade brought a profit of about 60 points. Thus, the day ended with a minimum profit, although much more could have been earned if the nature of the movement had been better.
COT report:
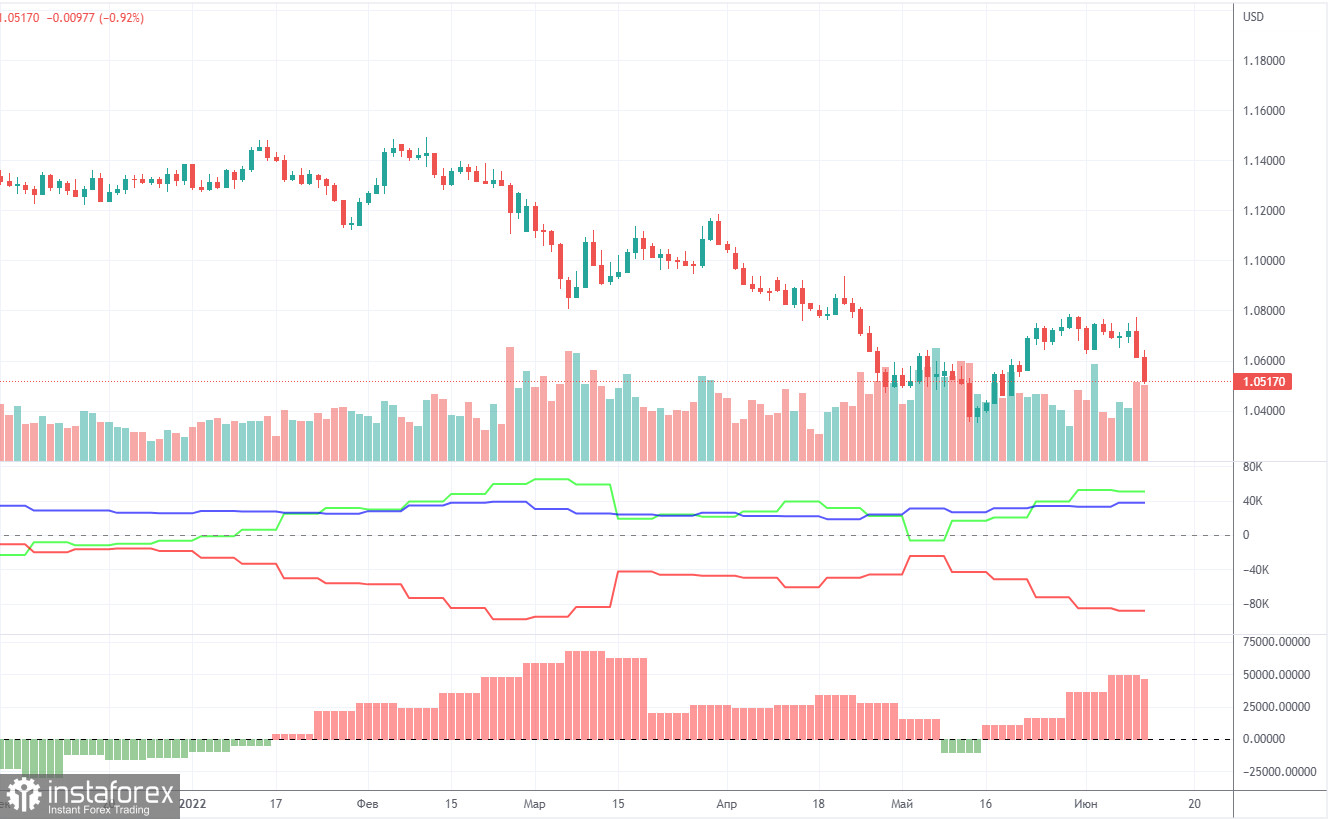
The latest Commitment of Traders (COT) reports on the euro raised a lot of questions. Recall that in the past few months, they showed a blatant bullish mood of professional players, but the euro fell all the time. At this time, the situation has not changed. The euro tried to show growth, but last week it collapsed. Therefore, we again have a situation in which the mood of the major players is bullish, but the euro is falling. The number of long positions decreased by 6,300 during the reporting week, and the number of shorts in the non-commercial group decreased by 4,500. Thus, the net position decreased by 1,800 contracts per week. The number of long positions exceeds the number of shorts for non-commercial traders by 50,000. The second indicator in the chart above perfectly shows that the net position has been positive for a long time, and the pair's movement chart in the same chart shows a downward movement. From our point of view, this happens because the demand for the US dollar remains much higher than the demand for the euro . The "respite" for the euro, which has been observed in recent weeks, did not last long, and the global downward trend remains in force. Therefore, we believe that the data of COT reports on the euro still cannot be relied upon when predicting the future movement of the euro/dollar pair.
We recommend to familiarize yourself with:
Overview of the EUR/USD pair. June 17. The Fed meeting remains in the past, but will not disappear from the memory of traders.
Overview of the GBP/USD pair. June 17. The Bank of England raised the key rate for the fifth time, the market ignored it again, the worst is yet to come.
Forecast and trading signals for GBP/USD on June 17. Detailed analysis of the movement of the pair and trading transactions.
EUR/USD 1H
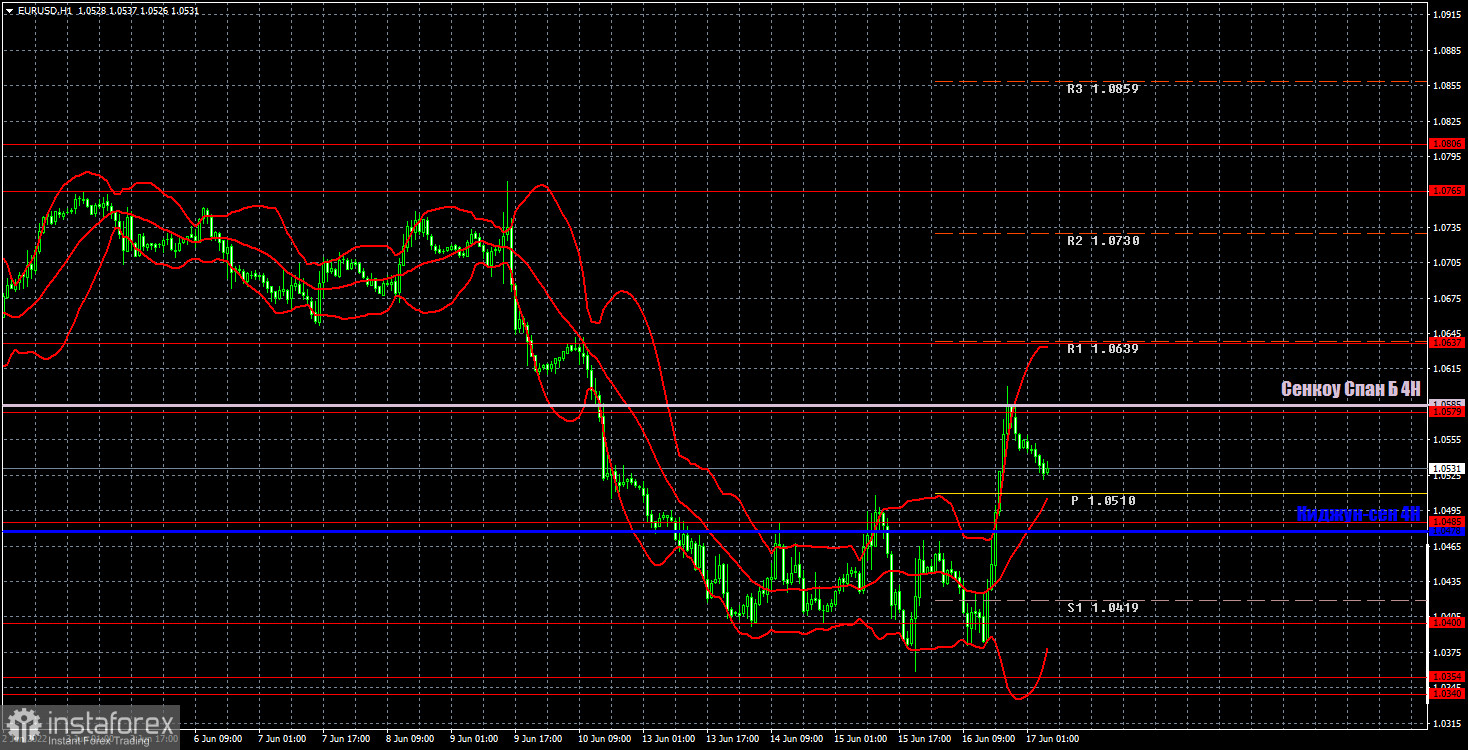
The pair started a sharp rise on the hourly timeframe, but as soon as we move to a higher timeframe, this rise looks quite ordinary and small compared to the fall that was before it. Therefore, it is still very early to open champagne for the euro. For the last two days, the market has been trading on emotions, and today and next week we will be able to see if the mood has changed to bullish or if the euro resumes to fall. Today, we highlight the following levels for trading - 1.0340-1.0354, 1.0400, 1.0485, 1.0579, 1.0637, as well as Senkou Span B (1.0585) and Kijun-sen (1 .0478). Ichimoku indicator lines can move during the day, which should be taken into account when determining trading signals. There are also secondary support and resistance levels, but no signals are formed near them. Signals can be "rebounds" and "overcoming" extreme levels and lines. Do not forget about placing a Stop Loss order at breakeven if the price has gone in the right direction for 15 points. This will protect you against possible losses if the signal turns out to be false. The European Union will release a report on inflation in the second assessment, and Powell will deliver a speech in America and the US industrial production report will also be released. We believe that traders will not significantly react to these events.
Explanations for the chart:
Support and Resistance Levels are the levels that serve as targets when buying or selling the pair. You can place Take Profit near these levels.
Kijun-sen and Senkou Span B lines are lines of the Ichimoku indicator transferred to the hourly timeframe from the 4-hour one.
Support and resistance areas are areas from which the price has repeatedly rebounded off.
Yellow lines are trend lines, trend channels and any other technical patterns.
Indicator 1 on the COT charts is the size of the net position of each category of traders.
Indicator 2 on the COT charts is the size of the net position for the non-commercial group.


