


GBP/USD 5M
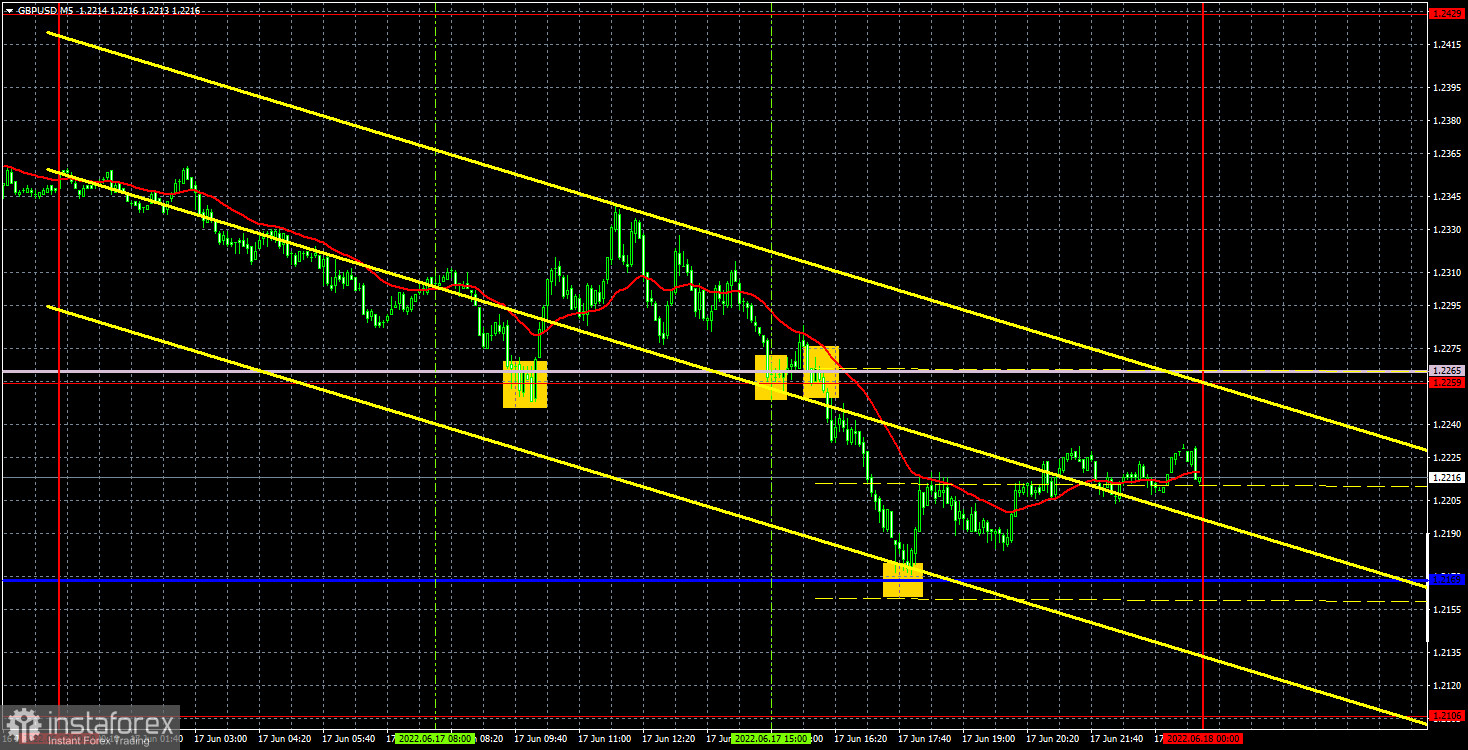
The GBP/USD currency pair calmed down a bit on Friday after a crazy Wednesday and Thursday, but the volatility still remained very high - almost 200 points. All these 200 points fell on a downward correction, which was quite logical amid the strongest growth the day before. However, at the same time, it was also too strong to count on the continued strengthening of the British currency. We still believe that European currencies can only count on corrective growth. Of course, the pound still has a little more reason to rise, as the Bank of England raised the key rate for the fifth time, and the results of the vote on the rate at the last meeting showed that members of the monetary committee are ready to continue to tighten monetary policy. However, the pound did not react too much to the previous four rate hikes, and inflation does not react at all to all the actions of the central bank and continues to accelerate, which we can verify this week, when the British inflation report for May is published. The fact that the price is above the critical line is good, but it is also below the Senkou Span B.
Trading signals on Friday were extremely mixed. It seems that in most cases the price moved a rather long distance in the right direction, but... The first buy signal was formed when the pair bounced off the extreme level of 1.2259. After that, it went up 56 points, which, in principle, is quite a lot. The trade had to be closed manually, as the nearest target level was far away. The next buy signal also formed near the level of 1.2259 and turned out to be false. It suffered a loss. Then the pair overcame the level of 1.2259, but this signal is no longer clear whether it was worth working out. Formally, the first two signals near the level of 1.2259 turned out to be false, but after the first signal the price went up 56 points, so it cannot be considered unambiguously false. As a result, we would work out this signal as well. After it, the price dropped to the critical line and worked it out perfectly. The profit was 60 points. And the last buy signal could also be worked out. It brought another 25 points of profit. Thus, it was possible to earn about 70 points on Friday.
COT report:
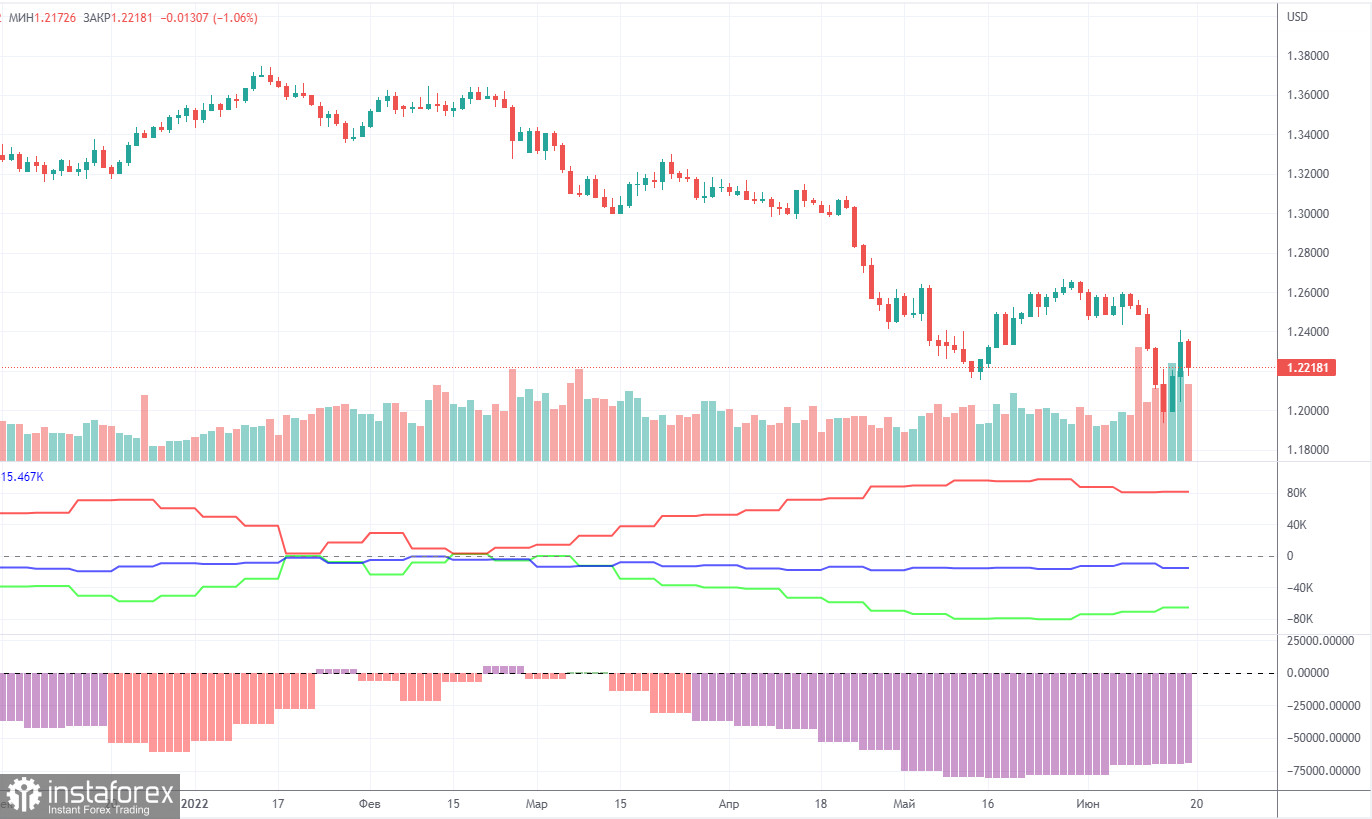
The latest Commitment of Traders (COT) report on the British pound showed insignificant changes. During the week, the non-commercial group closed 5,200 thousand long positions and 10,500 short positions. Thus, the net position of non-commercial traders increased by 5,300. However, the mood of major players still remains "pronounced bearish". And the pound, despite the growth of the net position, still continues to fall. The net position has been falling for three months, which is perfectly visualized by the green line of the first indicator in the chart above or the histogram of the second indicator. Therefore, two or three insignificant increases in this indicator hardly unequivocally indicate the end of the downward trend for the pound. The non-commercial group has a total of 95,000 short positions open and only 29,000 long positions. As you can see, the difference between these numbers is more than three times. We note that in the case of the pound, the COT report data very accurately reflects what is happening in the market: the mood of traders is "very bearish", and the pound has been falling against the US dollar for a long time. In the past few weeks, the pound has been trying to show growth, but even in the chart for this paragraph (daily timeframe), these attempts look pathetic. Since in the case of the pound, the COT report data reflects the real picture of things, we note that a strong divergence of the red and green lines of the first indicator often means the end of the trend. Therefore, formally now we can count on a new upward trend. However, weak geopolitical, fundamental and macroeconomic backgrounds for European currencies still put pressure on them.
We recommend to familiarize yourself with:
Overview of the EUR/USD pair. June 20. The new week is unlikely to bring anything good for the euro.
Overview of the GBP/USD pair. June 20. Pound: rapid rise, rapid fall.
Forecast and trading signals for EUR/USD on June 20. Detailed analysis of the movement of the pair and trading transactions.
GBP/USD 1H
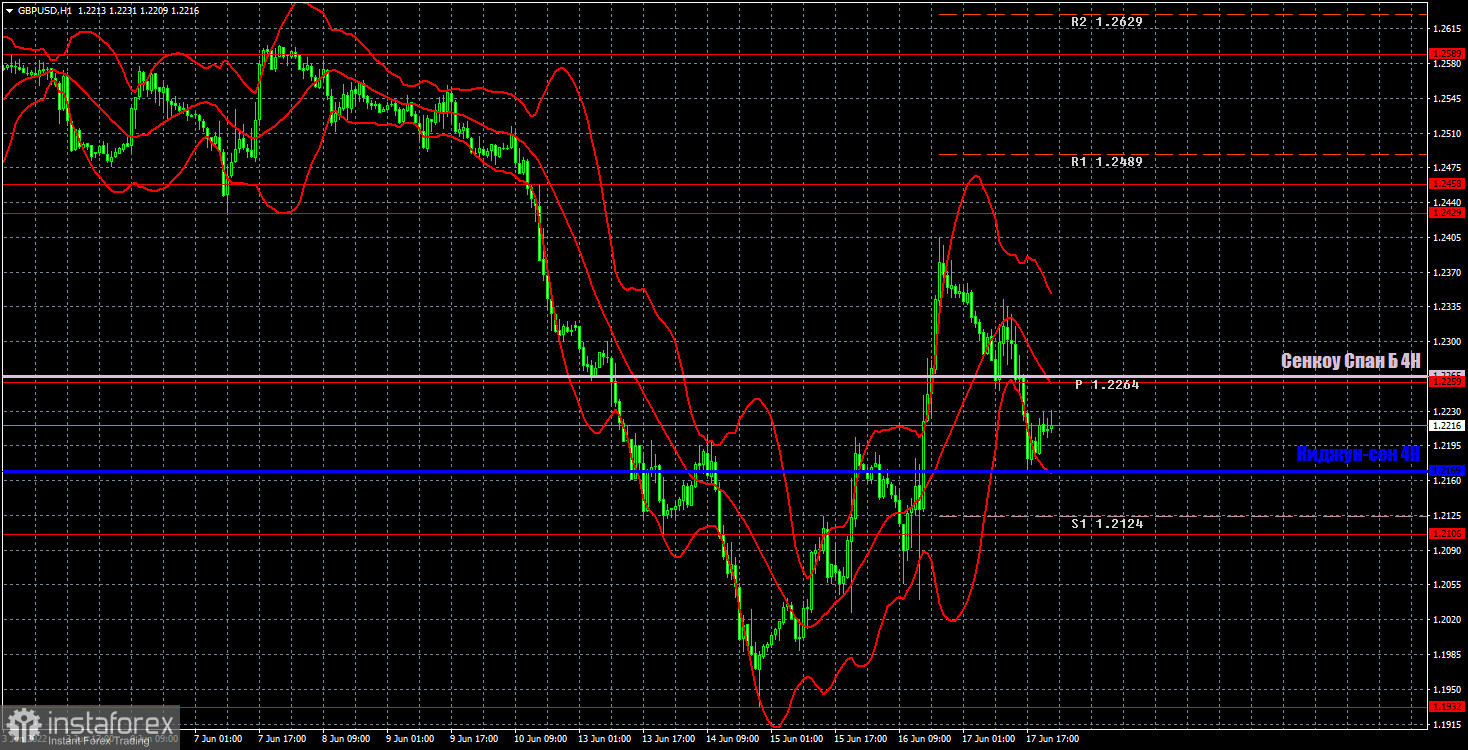
We see on the hourly timeframe the strongest increase that the pair showed on Wednesday and Thursday, and the strong fall that was shown on Friday. As long as the price is above the critical line, the pound retains chances for growth. But consolidating below Kijun-sen will mean a new verdict for the British currency. Today, we highlight the following important levels: 1.1932, 1.2106, 1.2259, 1.2429, 1.2458, 1.2589. Senkou Span B (1.2265) and Kijun-sen (1.2169) lines can also be sources of signals. Signals can be "rebounds" and "breakthrough" of these levels and lines. The Stop Loss level is recommended to be set to breakeven when the price passes in the right direction by 20 points. Ichimoku indicator lines can move during the day, which should be taken into account when determining trading signals. The chart also contains support and resistance levels that can be used to take profits on trades. There are no important or interesting events scheduled for Monday in the United States and Great Britain. The main task is to stay above the Kijun-sen.
Explanations for the chart:
Support and Resistance Levels are the levels that serve as targets when buying or selling the pair. You can place Take Profit near these levels.
Kijun-sen and Senkou Span B lines are lines of the Ichimoku indicator transferred to the hourly timeframe from the 4-hour one.
Support and resistance areas are areas from which the price has repeatedly rebounded off.
Yellow lines are trend lines, trend channels and any other technical patterns.
Indicator 1 on the COT charts is the size of the net position of each category of traders.
Indicator 2 on the COT charts is the size of the net position for the non-commercial group.


