


Trend analysis (Fig. 1).
The market may move upward from 1.0521 (close of yesterday's daily candle) to 1.0573, the 50% retracement level (yellow dotted line). After testing this level, the price may move down to the upper fractal at 1.0567 (daily candle from 06/22/2022). Upon reaching this level, a downward pullback is possible.
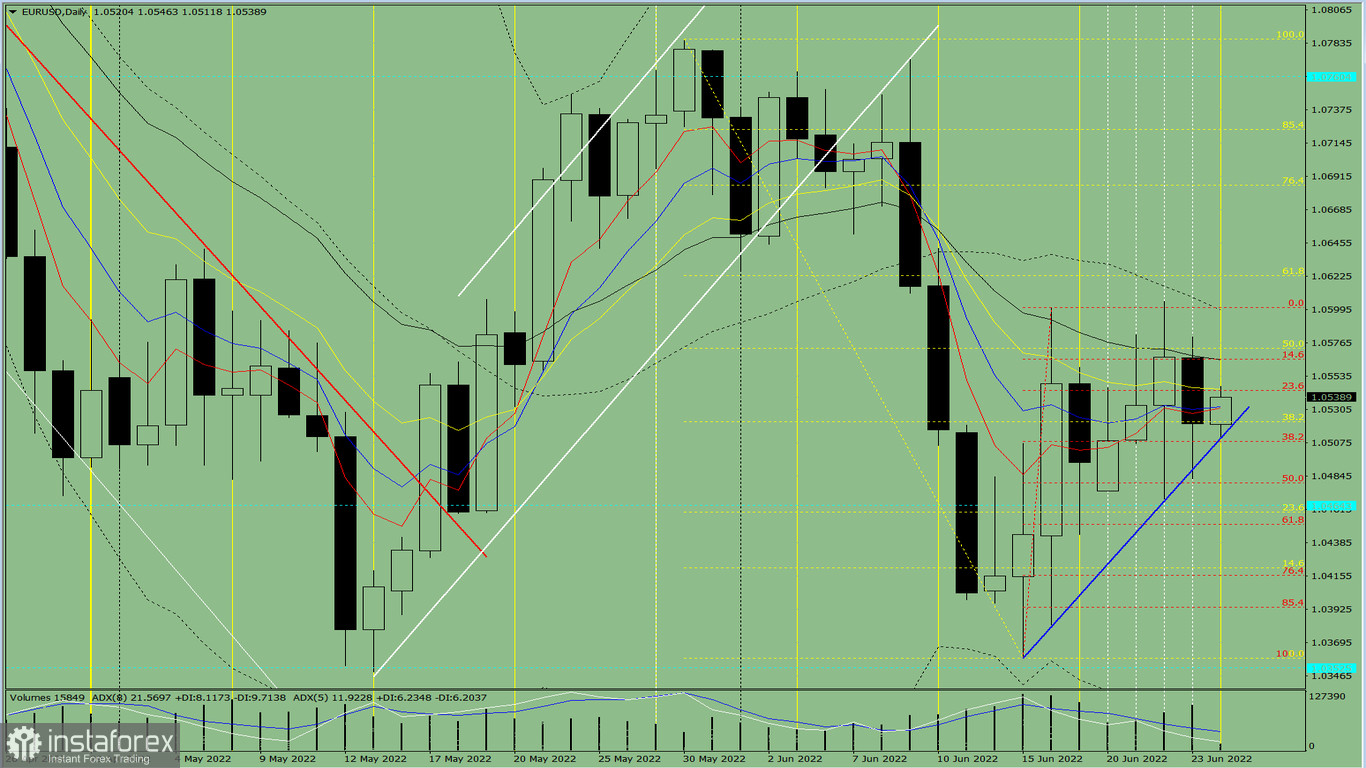
Fig. 1 (daily chart).
Comprehensive analysis:
- Indicator analysis – up;
- Fibonacci levels – up;
- Volumes – down;
- Candlestick analysis – up;
- Trend analysis – up;
- Bollinger bands – up;
- Weekly chart – up.
Today the price may move upward from 1.0521 (close of yesterday's daily candle) to 1.0573, the 50% retracement level (yellow dotted line). After testing this level, the price may move down to the upper fractal at 1.0567 (daily candle from 06/22/2022). Upon reaching this level, a downward pullback is possible.
Alternative scenario: from the level of 1.0521 (close of yesterday's daily candle), the price may move upward to 1.0573, the 50% retracement level (yellow dotted line). After testing this level, a downward movement is possible with the target of 1.0545, the 23.6% retracement level (red dotted line). Upon reaching this level, the price may move up.

