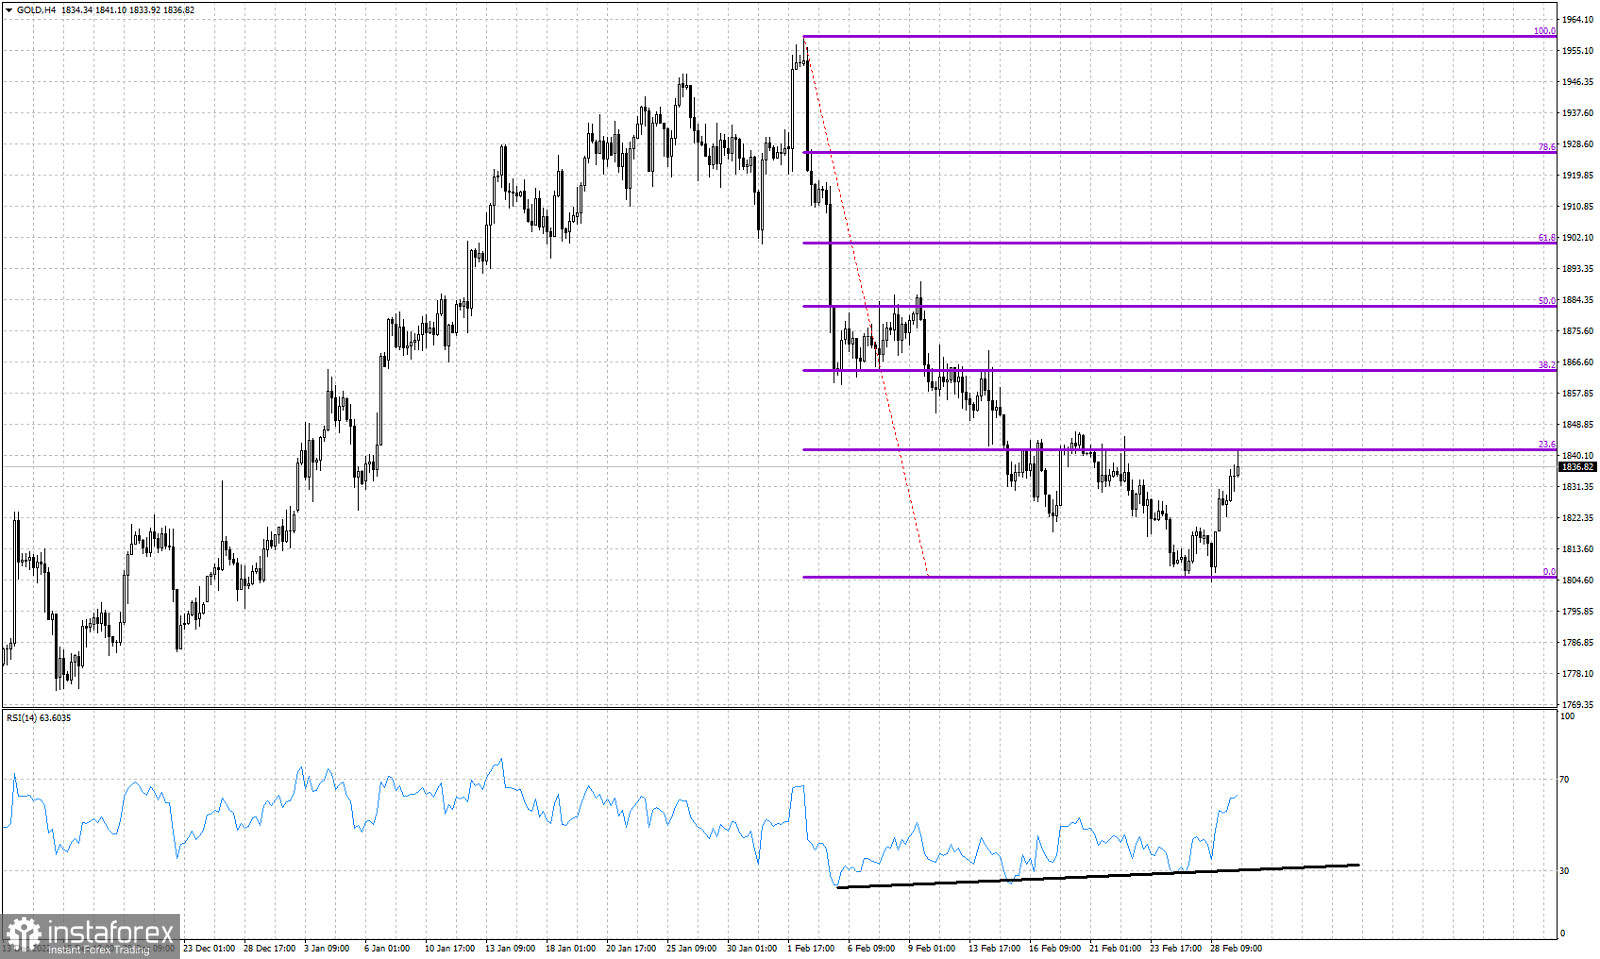
Violet lines- Fibonacci retracements
Black line- bullish RSI divergence
Gold price is bouncing higher. The RSI has already warned traders of the increased chances of a bounce. We have been receiving bullish divergence signals by the RSI for some time now. Gold price has most probably completed the downward wave from $1,959 and has now started a counter move. Was the decline just a pause to a bigger up trend or is this upward move just a counter trend bounce? Longer-term trend remains bullish as we explained yesterday. However there are increased chances of a bigger pull back. Focusing on the near term, we see price bouncing towards $1,865 where we find the first important resistance level. Next major resistance is at $1,900. Will Gold price continue higher and break resistance levels or we will see rejections and bearish reversals? For now we consider yesterday's low at $1,804 as the most important short-term support level.


