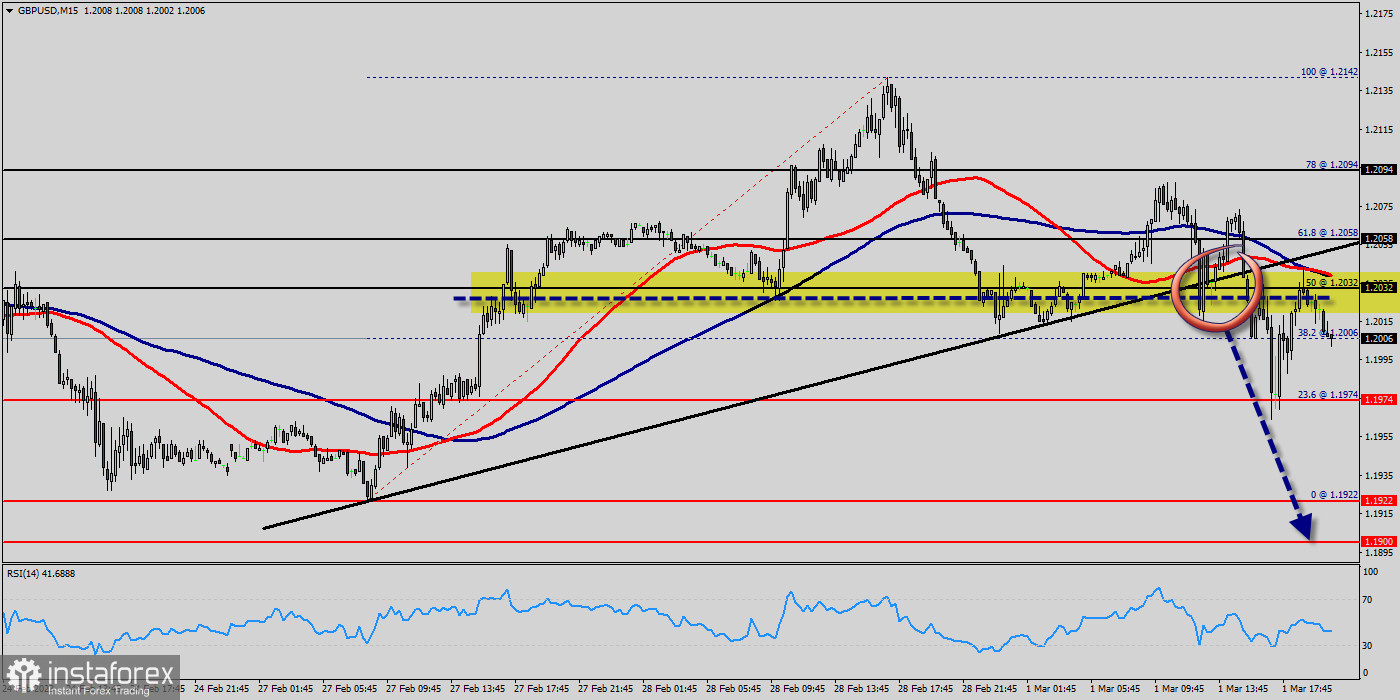
Yesterday the GBP/USD traded lower and closed the day in the red area near the price of 1.2005 - 1.1974. Today it, on the contrary, grew a little, having risen to the level of 1.2032. On the hourly chart, the GBP/USD pair is testing the strength of the support - the moving average line MA (100) H1 (1.1991). At the same chart, the GBP/USD pair is still below the MA 100 H1 line - the first resistance of 1.2032.
Based on the foregoing, it is probably worth sticking to the north direction in trading, and as long as the GBP/USD pair remains below MA 100 H1, it may be necessary to look for entry points to buy at the end of the correction.
The GBP/USD pair tests 1.2032 level and still below it, and the contradiction between the technical indicators still valid, to continue with our neutrality until the price confirms its situation according to the mentioned level followed by detecting its next destination clearly. To review the expected targets for the upcoming period, please check our morning report.
Intraday bias in GBP/USD pair stays on the downside, as fall from 1.2032 is targeting 100 day EMA (now at 1.2000). Firm break there will target 23.6% retracement of 1.1974 to 1.1922.
The expected trading range for today is between 1.1922 support and 1.2032 resistance. The GBP/USD pair has extended its daily slide and declined below 1.2032. With the US Dollar staying resilient against its rivals following the better-than-forecast data, the pair is having a difficult time staging a rebound in the early American session.
On the other hand, if the GBP/USD pair fails to break through the resistance level of 1.2032 this week, the market will decline further to 1.1974.
The pair is expected to drop lower towards at least 1.1974 with a view to test the weekly pivot point.
Also, it should be noted that the weekly pivot point will act as minor support today at the price 1.1974.
Indicators : This would suggest a bearish market because the moving average (100) is still in a positive area and does not show any trend-reversal signs at the moment. EMAs gives more weight to the most recent periods, because moving average is quick moving and works well at showing recent price swings. On the other hand, Simple Moving Average (SMA) displays a smooth chart which which removes most false signals.
Moreover, with using SMAs, you can know whether a pair is trending up or trending down. Consequently, if you want to obtain a clearer signal of whether the pair is trending up or down if you combine two or more moving averages because simple and exponential are the two major types of moving averages.
The trend is still bearish as long as the price of 1.2032 is not broken. Thereupon, it would be wise to sell below the price of at 1.2032 with the primary target at 1.1974. Then, the GBP/USD pair will continue towards the second target at 1.1922 (a new target is around 1.1900). The breakdown of 1.1900 will allow the pair to go further down to the prices of 1.1850 and 1.1800.


