


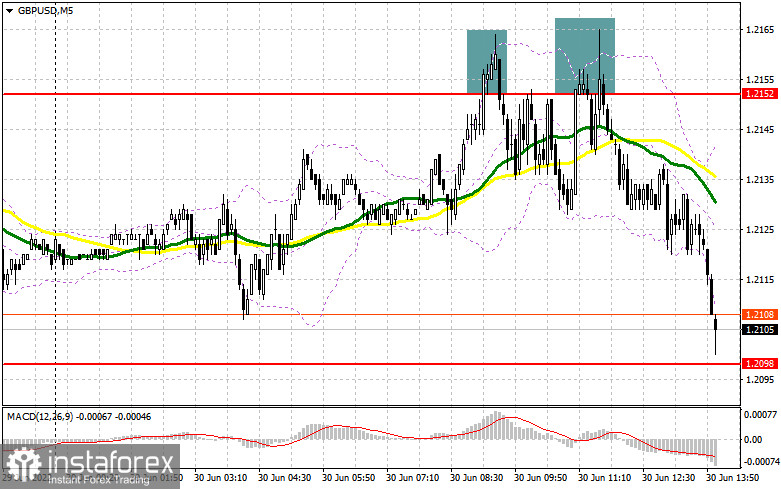
In my morning forecast, I paid attention to the level of 1.2152 and recommended making decisions from it. Let's look at the 5-minute chart and figure out what happened there. An attempt to grow and build an upward corrective impulse failed before it could begin. A false breakout at 1.2152 led to a signal to open short positions, which eventually resulted in a large sale of more than 50 points. From a technical point of view, practically nothing has changed for the second half of the day, as well as the strategy has not changed. And what were the entry points for the euro?
To open long positions on GBP/USD, you need:
Buyers of the British pound do not have a single reason to build up long positions. Today's statistics have confirmed this. According to the Office for National Statistics, adjusted for inflation, household incomes fell by 0.2% in the first three months of this year. The UK's gross domestic product grew by 0.8% in the first quarter of this year, while output remained 0.7% above the pre-pandemic level. Against this background, the bulls made an unsuccessful attempt to grow above 1.2152, which has now transformed into 1.2159. In the afternoon, reports are expected on the index of personal consumption expenditures, the number of initial applications for unemployment benefits, and the Chicago PMI business activity index. If the data exceeds economists' forecasts, the pound may continue to fall. In this case, buyers will have to rely on the protection of the nearest support of 1.2098, formed by the results of yesterday. Updating this level and forming a false breakdown on it will be the first signal to open long positions to recover to the area of 1.2152, which, as I have already said, is very important for bulls. A breakout and a top-down test of 1.2152 will give a buy signal already to update 1.2207. A similar breakthrough at this level will lead to another entry point into long positions with the prospect of reaching 1.2267, where I recommend fixing the profits. A more distant target will be the area of 1.2329, but it is very early to talk about this since the market is under the control of sellers. If GBP/USD falls and there are no buyers at 1.2098, and for this, the bears have everything they need, only some new trigger is needed - all this will greatly affect the technical picture, which will increase the pressure on the pair. In this case, I recommend postponing long positions until the next support of 1.2042. I advise you to buy there only on a false breakdown. It is possible to open long positions on GBP/USD immediately for a rebound from 1.1993, or even lower – around 1.1938 with the aim of correction of 30-35 points within a day.
To open short positions on GBP/USD, you need:
The bears did everything possible to keep the market under their control and they succeeded. In case of weak data on the US, it will be possible to observe another spurt of the pound up to the area of 1.2159. Therefore, only the formation of a false breakdown at this level will lead to the formation of a sell signal with the prospect of a return to 1.2098. Fixing below 1.2098 and the reverse test from the bottom up will greatly affect the bulls' stop orders, which form an additional entry point for the sale of the pound with the aim of further decline to 1.2042, where I recommend partially fixing profits. A more distant target will be the area of 1.1993, and there you can reach the annual minimum of 1.1938. With the option of GBP/USD growth and the absence of bears at 1.2158 in the afternoon, we will only have to count on the nearest resistance of 1.2207. As practice shows, the main sales of the pound are now taking place during North American trading, so a false breakout at 1.2207 will give a good entry point into short positions in the expectation of a rebound of the pair down. If there is no activity at 1.2207, another upward jerk may occur against the background of the demolition of stop orders of speculative sellers. In this case, I advise you to postpone short positions to 1.2267. You can look at selling GBP/USD immediately for a rebound from 1.2329, counting on the pair's rebound down by 30-35 points within a day.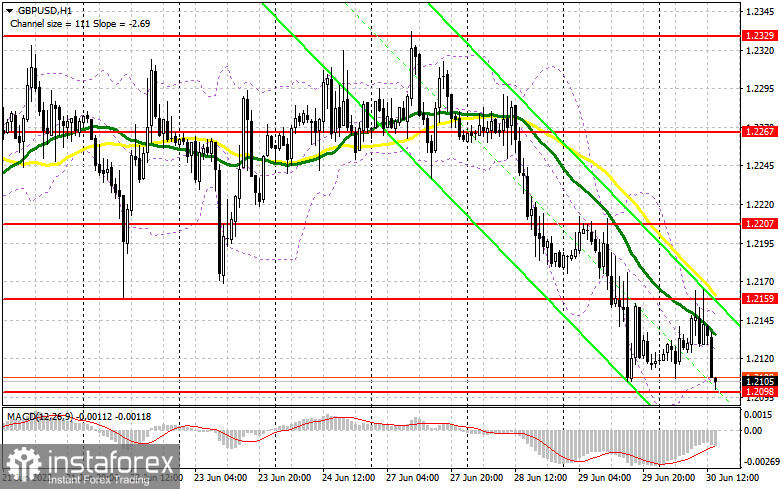
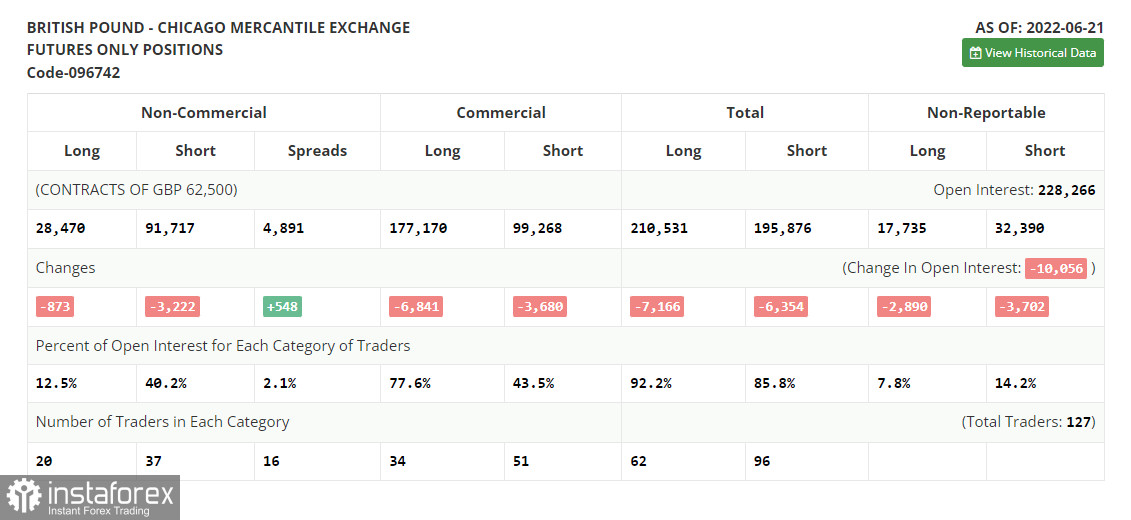
The COT report (Commitment of Traders) for June 21 recorded a reduction in both long and short positions, but the latter turned out to be more, which led to a slight decrease in the negative delta. Last week, inflation data in the UK confirmed the correctness of the Bank of England's position on monetary policy. The sharp inflationary jump in May of this year was nothing surprising for traders since even according to the official forecasts of the regulator, the consumer price index will exceed the mark of 11.0% by the end of the year. The big players, of course, took advantage of the moment and increased their long positions as a result of another collapse of the pound, but now, according to the report, we see that fewer people are willing to sell at current lows, which plays on the side of the British pound. No one will be surprised by the policy of the Federal Reserve System and its rate of interest rate increases, so it's time to think about buying cheaper risky assets. The COT report indicates that long non-commercial positions decreased by only 873 to the level of 28,470, while short non-commercial positions decreased by 3,222 to the level of 91,717. This led to a decrease in the negative value of the non-commercial net position from the level of -65,596 to the level of -63,247. The weekly closing price rose to 1.2295 against 1.1991.
- Moving average (moving average determines the current trend by smoothing out volatility and noise). Period 50. The graph is marked in yellow.
- Moving average (moving average determines the current trend by smoothing out volatility and noise). Period 30. The graph is marked in green.
- MACD indicator (Moving Average Convergence / Divergence - moving average convergence/divergence) Fast EMA period 12. Slow EMA period 26. SMA period 9
- Bollinger Bands (Bollinger Bands). Period 20
- Non-profit speculative traders, such as individual traders, hedge funds, and large institutions use the futures market for speculative purposes and to meet certain requirements.
- Long non-commercial positions represent the total long open position of non-commercial traders.
- Short non-commercial positions represent the total short open position of non-commercial traders.
- Total non-commercial net position is the difference between the short and long positions of non-commercial traders.


