Technical Market Outlook:
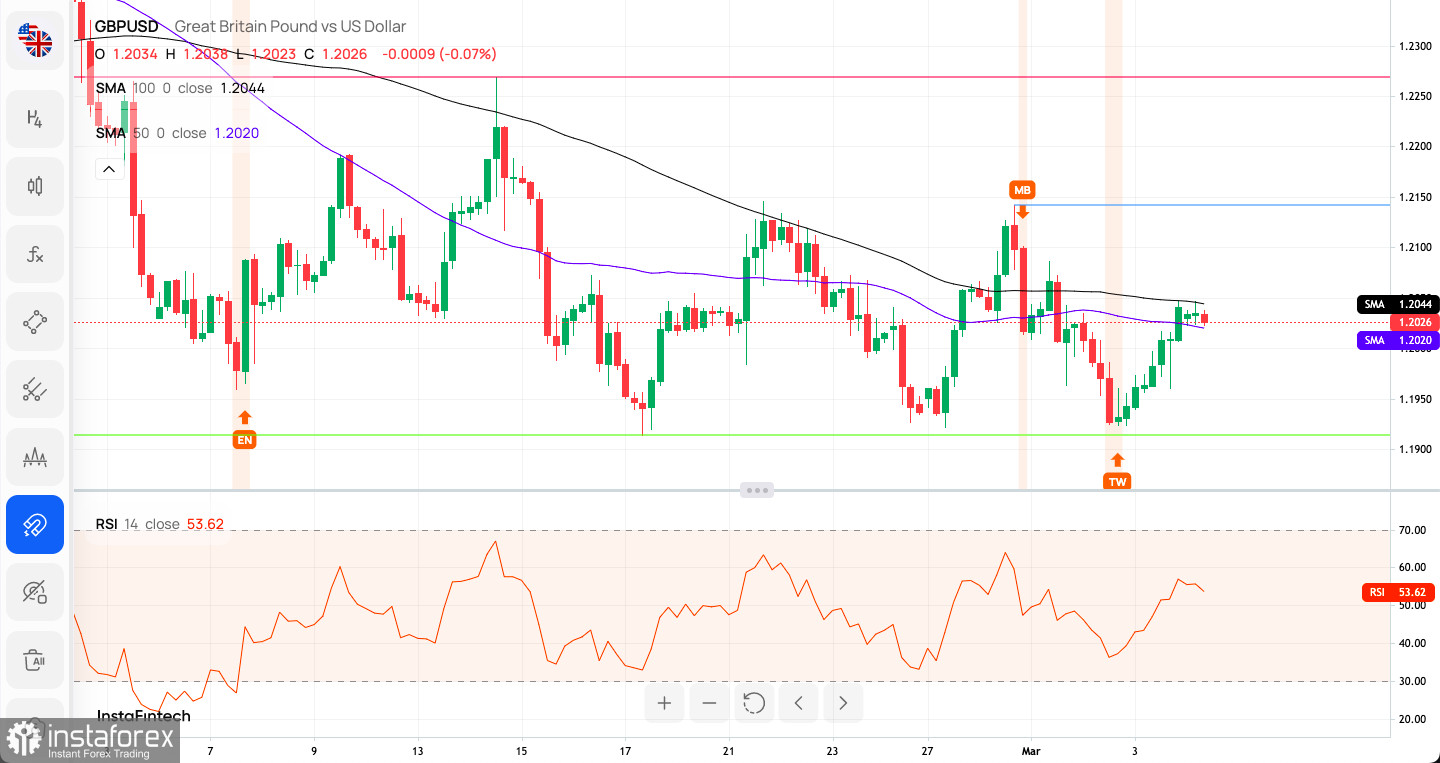
The GBP/USD pair has been trading inside a horizontal range located between the levels of 1.2146 - 1.1922, so the market remains under the bearish control (higher time frame trend is down). The level of 1.2087 will now act as a technical resistance as well, so a breakout above this level of needed in order to rally higher. The momentum is positive on the H4 time frame chart, but is not that strong yet as the bulls are trying to regain the control back. The level of 1.1914 remains the key short-term technical support. Please be aware of the 50 MA and 100 MA bearish cross on the H4 time frame as well.

Weekly Pivot Points:
WR3 - 1.20820
WR2 - 1.20580
WR1 - 1.20444
Weekly Pivot - 1.20340
WS1 - 1.20204
WS2 - 1.20100
WS3 - 1.19860
Trading Outlook:
So far the level of 1.2443 was too strong resistance to break through, so a potential Double Top price pattern is still in play. Moreover, the level of 1.2297 which is 50% Fibonacci retracement level of the last big wave down had been hit, so the bears resumed the down trend. The down trend was confirmed with the level of 1.2089 breakout (50 WMA), so now the potential target for bears is seen at the level of 1.1840 or below.


