Technical analysis:

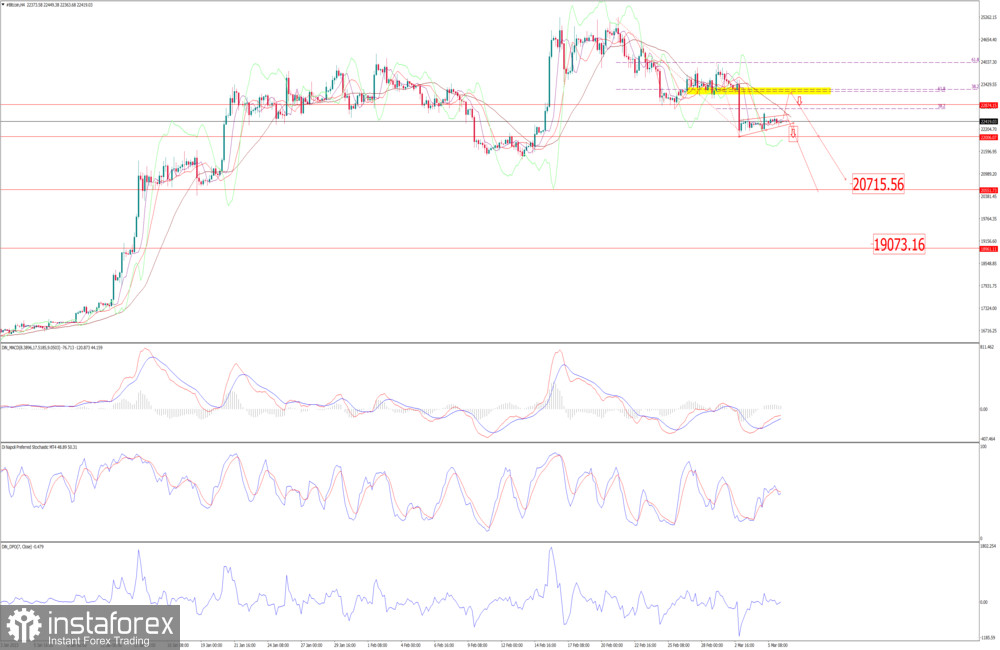
BTC/USD has been trading sideways at the price of $22.400 after the drop in the background. There is the potential for the downside continuation.
In case of the downside breakout of the flag pattern and breakout of the $22.000, I see potential for the further drop towards the $20.700
In case of the rally, there is the big resistance Fibonacci cluster at $23.250. Potential for the downside continuation of the zone in case of the rally first...


