


Trend analysis (Fig. 1).
The euro-dollar pair may move upward from the level of 1.0422 (close of yesterday's daily candle) to 1.0460, the 38.2% retracement level (red dotted line). When testing this level, the price may continue to move upward to 1.0490, the 50.0% retracement level (red dotted line). From this level, a downward movement is possible.
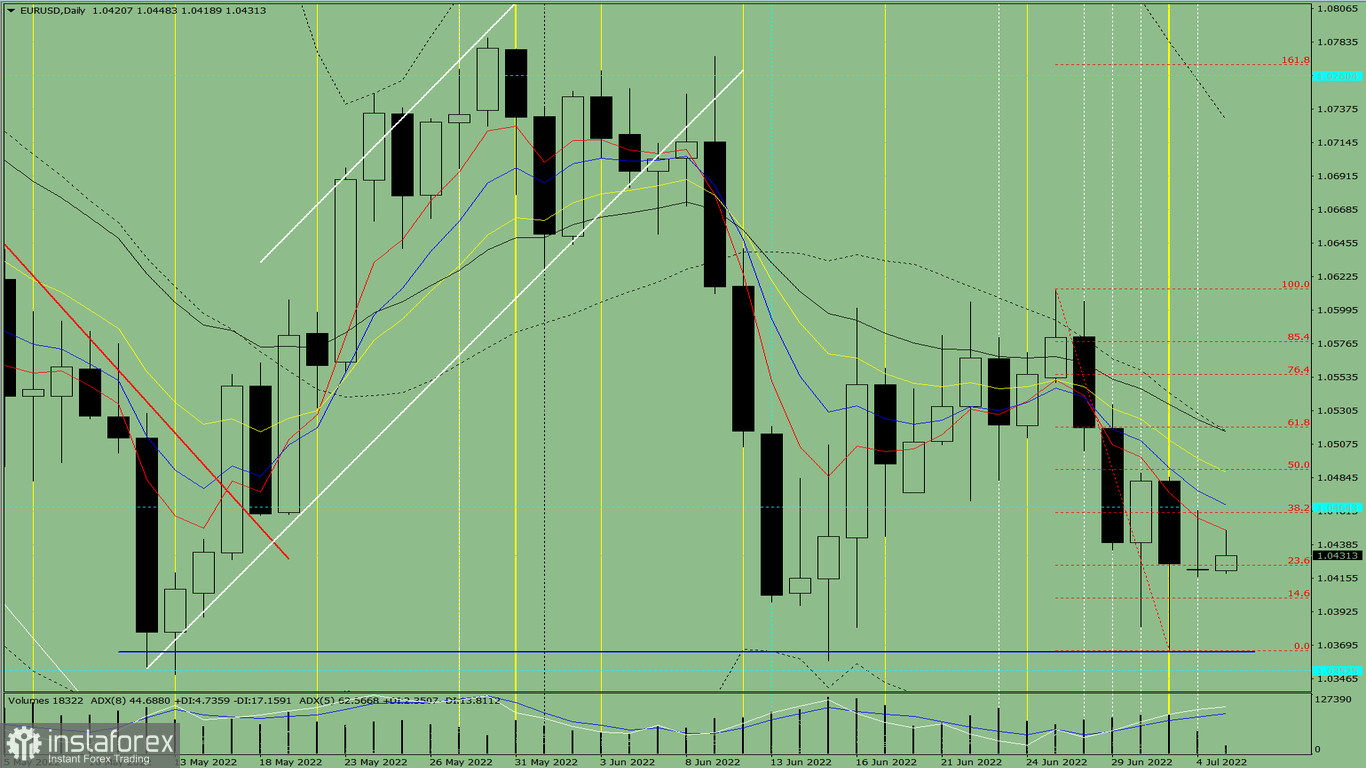
Fig. 1 (daily chart).
Comprehensive analysis:
- Indicator analysis – up;
- Fibonacci levels – up;
- Volumes – up;
- Candlestick analysis – up;
- Trend analysis – up;
- Bollinger bands – up;
- Weekly chart – up.
General conclusion:
Today the price may move upward from the level of 1.0422 (close of yesterday's daily candle) to 1.0460, the 38.2% retracement level (red dotted line). When testing this level, the price may continue to move upward to 1.0490, the 50.0% retracement level (red dotted line). From this level, a downward movement is possible.
Alternative scenario: from the level of 1.0422 (close of yesterday's daily candle), the price may move upward to 1.0460, the 38.2% retracement level (red dotted line). When testing this level, a downward movement is possible to the lower fractal at 1.0366 (red dotted line). From this level, the price may move up.


