


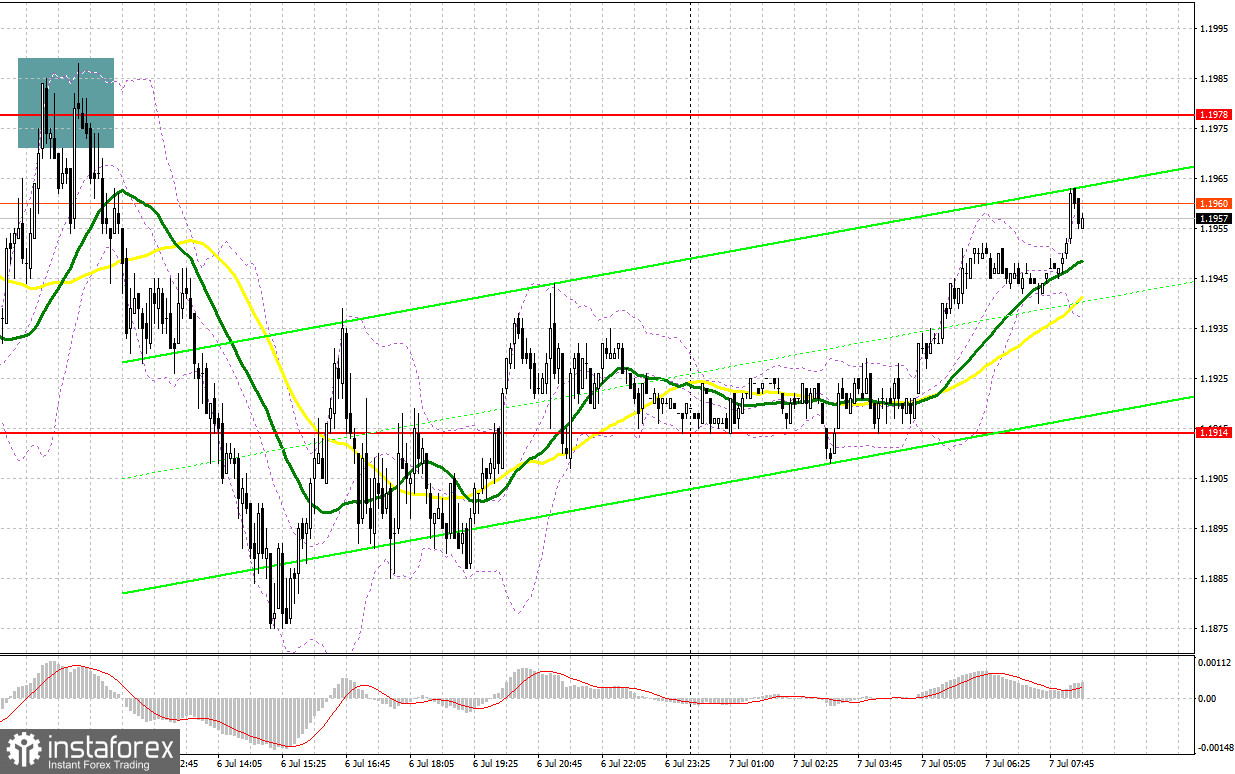
Several market entry signals were formed yesterday. Let's take a look at the 5-minute chart and see what happened. I paid attention to the 1.1908 level in my morning forecast and advised making decisions from it. A decline and forming a false breakout at this level resulted in creating a signal to buy the pound, which rapidly rose by 60 points to the area of 1.1968. But even if you did not have time or did not consider a buy signal, then the best solution was to sell on a false breakout around 1.1968. The release of a rather weak PMI on the construction sector in the UK was the reason for building up short positions. In total, the pair went down by more than 80 points. Unfortunately, it was not possible to receive normal signals for entering the market in the afternoon, since the level of 1.1914 was rather "smeared" and I did not see any convenient entry points.
When to go long on GBP/USD:
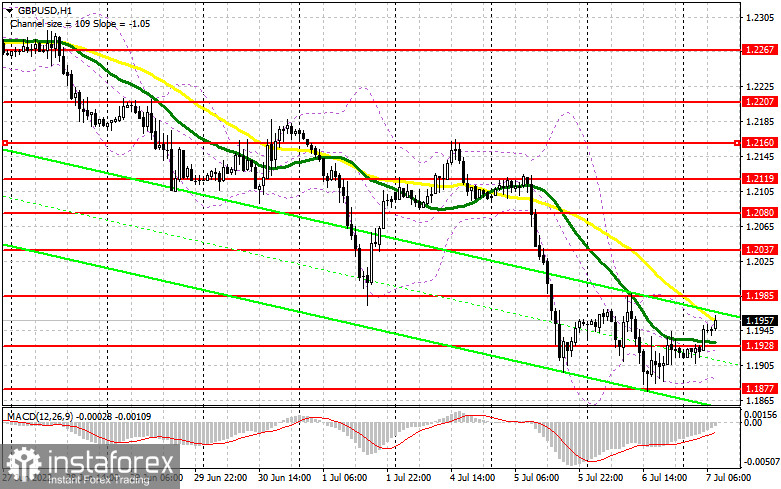
The lack of reaction to yesterday's minutes of the Federal Reserve was quite expected, since they did not change the balance of power in the market. Investors and traders already understand the central bank's succeeding plans to regain control of inflation, which makes the Fed's policy more transparent. The UK will only release data on labor productivity and the housing price index today. Good indicators will allow the bulls to protect the nearest support at 1.1928, which I advise you to focus on in the morning. An update of this level and forming a false breakout on it will be the first signal to open long positions with the goal of moving up to the area of 1.1985, which acts as a kind of upper limit of the short-term horizontal channel. A breakthrough and downward test of 1.1985 will provide a buy signal with the goal of a sharper upward jump and an update of 1.2037. A similar breakthrough of this level will lead to another entry point into long positions with the prospect of exiting at 1.2080, where I recommend taking profits. A more distant target will be the area of 1.2119, but it's too early to talk about it, since the bears are in control of the market.
If GBP/USD falls and there are no bulls at 1.1928, and this will most likely be the case if we receive disappointing UK statistics, all this will increase pressure on the pair. In this case, I recommend postponing long positions to the lower border of the channel and the year's low at 1.1877. I advise you to buy there only on a false breakout. You can open long positions on GBP/USD immediately for a rebound from 1.1816, or even lower - around 1.1742 counting on correcting 30-35 points within the day.
When to go short on GBP/USD:
Yesterday, bears updated weekly and annual lows, which keeps the downward trend and the market completely under their control. In case GBP/USD grows in the first half of the day after the release of UK data, forming a false breakout at the level of 1.1985 will provide the first entry point into short positions in continuation of the bearish scenario and with the prospect of a return to 1.1928. Consolidation below 1.1928 and a reverse test from the bottom up will greatly affect the bulls' stop orders, which creates an additional entry point for short positions while aiming for a further decline to 1.1877, where I recommend partially taking profits. A more distant target will be the area of 1.1816, the test of which will be evidence of the resumption of the downward trend. A more distant target will be the area of 1.1742.
In case GBP/USD grows and the bears are not active at 1.1985, we can only count on strong statistics on the US labor market, which is expected in the afternoon and on the next resistance at 1.2037. A false breakout at this level will provide a good entry point to short positions, counting on the pair bouncing down. In case of lack of activity and at 1.2037, another upsurge may occur amid the removal of stop orders of speculative sellers. In this case, I advise you to postpone short positions until 1.2080. You can sell GBP/USD immediately on a rebound from 1.2119, based on the pair's rebound down by 30-35 points within the day.
COT report:
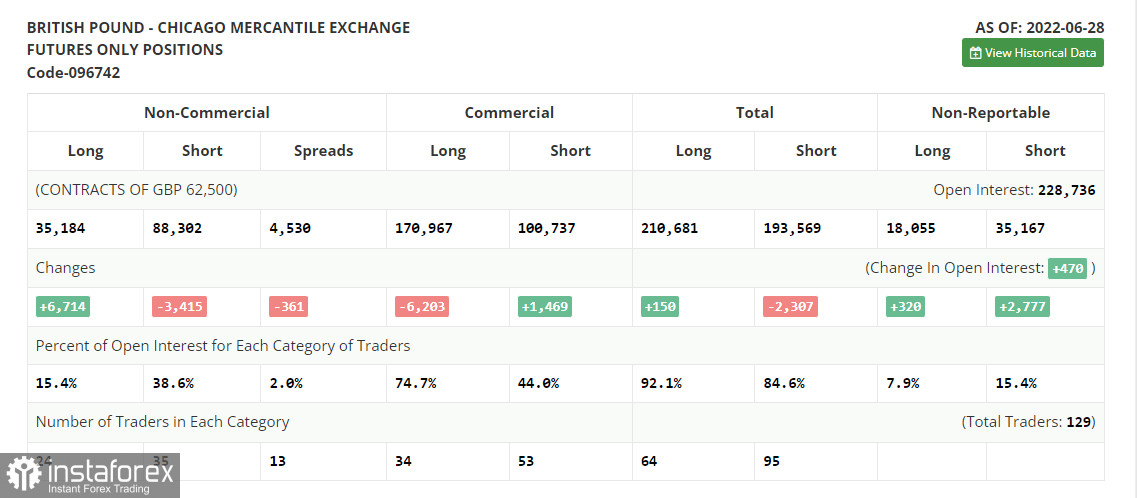
The Commitment of Traders (COT) report for June 28 logged a decline in short positions and a sharp increase in long positions, which indicates an attempt to buy another annual low after the Bank of England's decision to raise interest rates and remain committed to an aggressive monetary policy. The sharp inflationary surge in May of this year does not leave the central bank a chance for a softer tightening cycle. The ongoing cost of living crisis in the UK is making the economy more vulnerable, especially as rates are forced to rise to fight high inflationary pressures. All this does not add to the pound's appeal, which is steadily moving down to the lows of 2020. The policy of the Federal Reserve and its pace of interest rate hikes is giving the dollar much more support. The COT report indicated that long non-commercial positions rose 6,714 to 35,184, while short non-commercial positions decreased 3,415 to 88,302, however this did not greatly affect the overall picture of the bear market, and led only to a small decrease in the negative value of the non-commercial net position from the level of -63,247 to the level of -53,118. The weekly closing price decreased and amounted to 1.2201 against 1.2295.
I recommend to read:
Indicator signals:
Moving averages
Trading is carried out in the area of 30 and 50-day moving averages, which indicates market uncertainty.
Note: The period and prices of moving averages are considered by the author on the H1 hourly chart and differs from the general definition of the classic daily moving averages on the daily D1 chart.
Bollinger Bands
In case of growth, the area of 1.1950 will act as resistance. In case of a decline in the pair, the lower border of the indicator in the area of 1.1895 will act as support.
Description of indicators
- Moving average (moving average, determines the current trend by smoothing out volatility and noise). Period 50. It is marked in yellow on the chart.
- Moving average (moving average, determines the current trend by smoothing out volatility and noise). Period 30. It is marked in green on the chart.
- MACD indicator (Moving Average Convergence/Divergence — convergence/divergence of moving averages) Quick EMA period 12. Slow EMA period to 26. SMA period 9
- Bollinger Bands (Bollinger Bands). Period 20
- Non-commercial speculative traders, such as individual traders, hedge funds, and large institutions that use the futures market for speculative purposes and meet certain requirements.
- Long non-commercial positions represent the total long open position of non-commercial traders.
- Short non-commercial positions represent the total short open position of non-commercial traders.
- Total non-commercial net position is the difference between short and long positions of non-commercial traders.


