


NZD/USD:
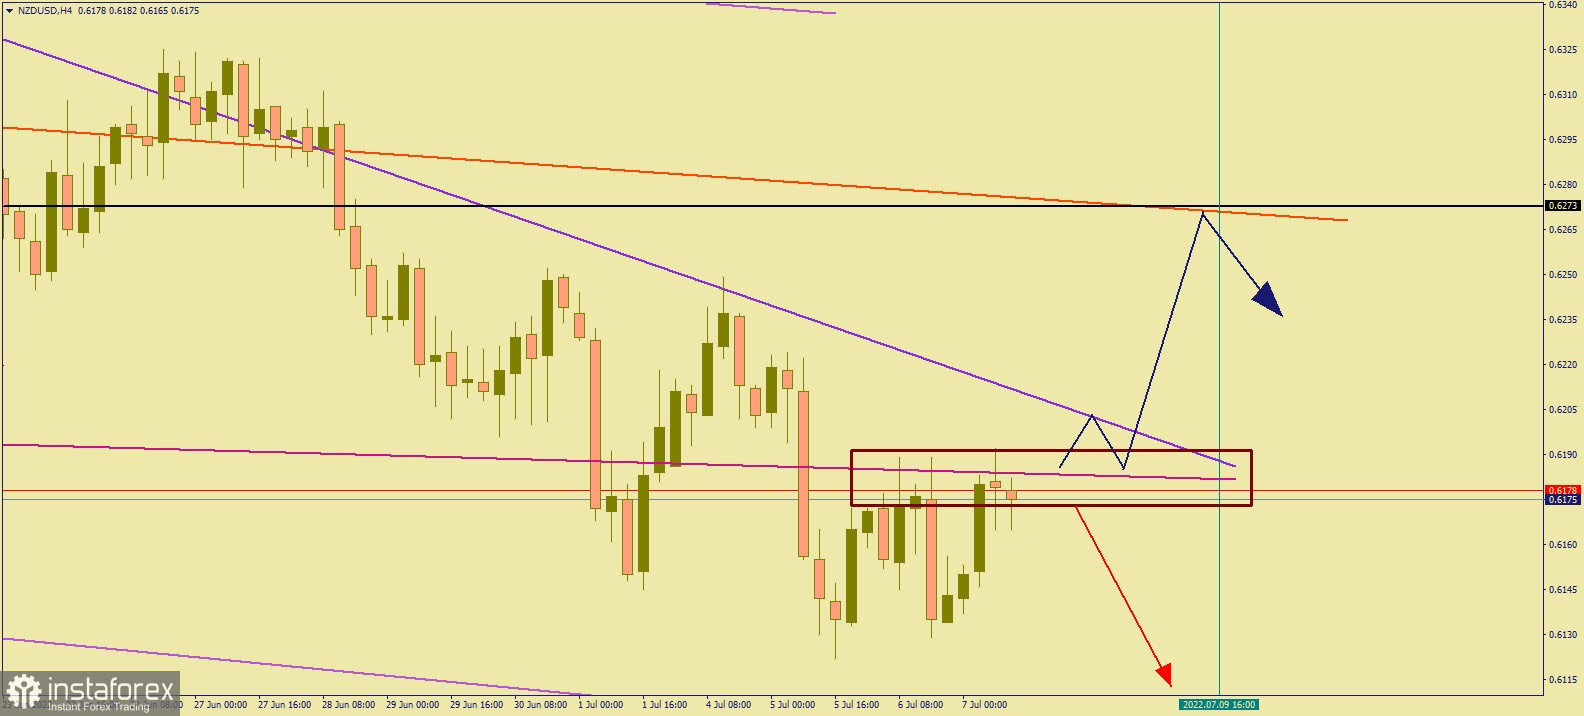
The graph shows the current movement of NZD/USD in the 4-hour (H4) chart.
In the traded resistance area of the currency pair (0.6175-0.6195), which is marked with a rectangle, there is a divergence formed by the intersection of inclined lines. This indicates a possible strong movement in the near future.
If the value of the pair remains below the indicated area, expect a continued decrease to 0.6090-0.6080.
The indicated area forms a strong support (resistance) level for the pair.
A breakdown of it may lead to an increase to 0.6273, with a possible rollback as shown on the chart.
Gold:
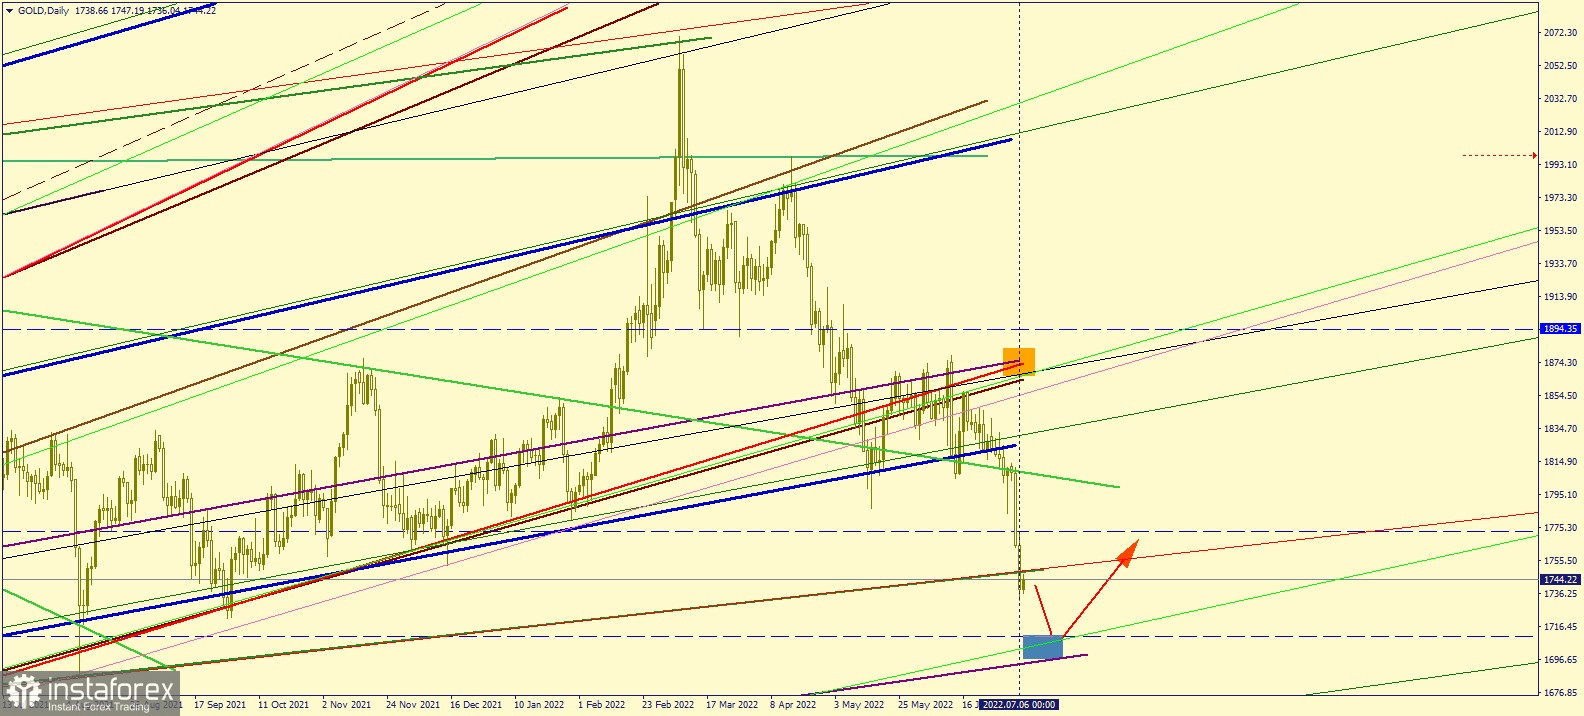
The chart shows the current movement of gold in the daily (D1) chart.
Gold continues its downward movement, influenced by the divergence zone located in the area of the intersection of the inclined lines, which is marked with a yellow rectangle.
The blue rectangle marks the most favored zone for a price reversal.
The support area is within $1,710-$1,695.
In case of a breakdown, expect a price decrease to $1,670.


