


Details of the economic calendar from July 8
The report of the US Department of Labor was considered the main macroeconomic event of the past week, where unemployment remained at the same level of 3.6%. At the same time, 372,000 new jobs were created outside of agriculture, while the forecast was 268,000. US labor market data came out noticeably better than expected, but, at this time, the dollar was already heavily overbought.
Analysis of trading charts from July 8
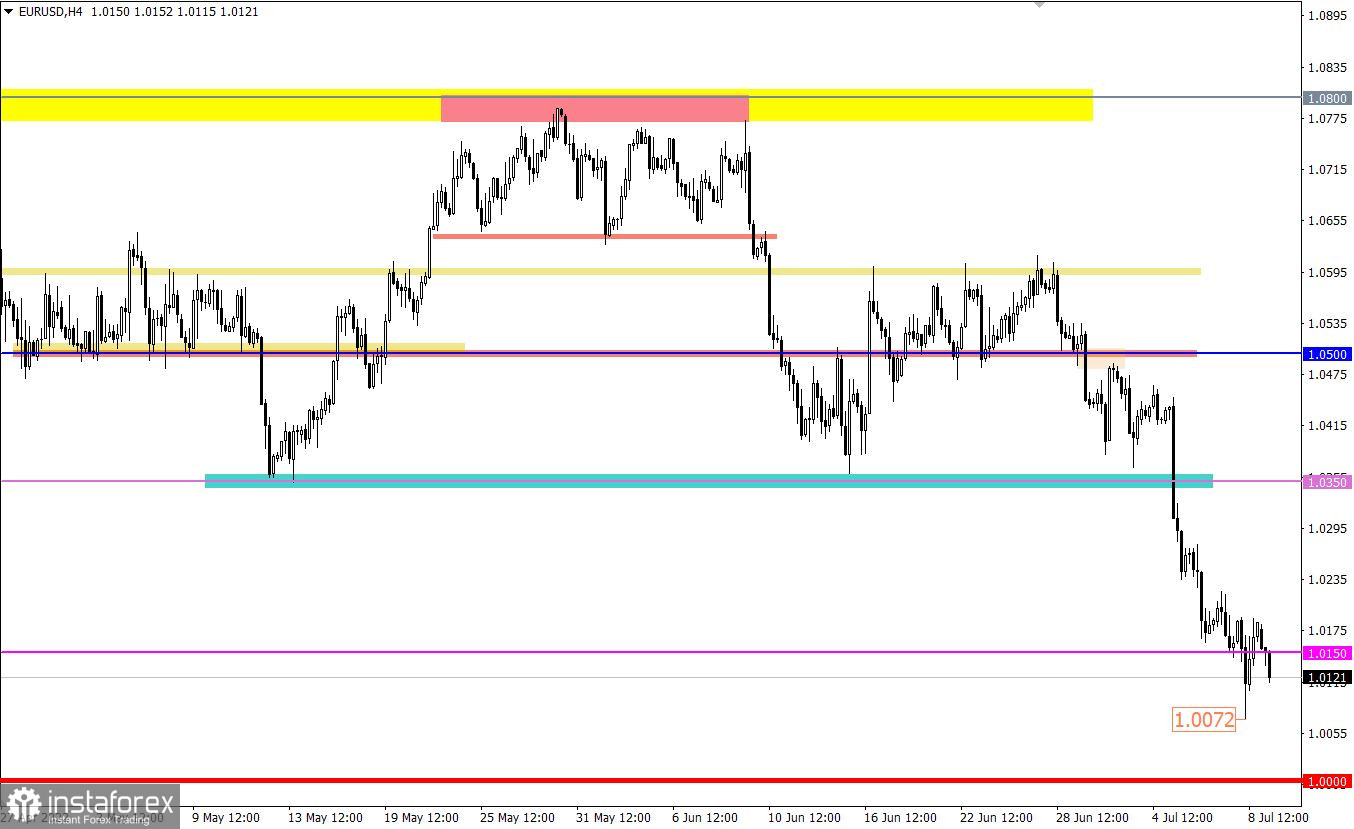
During the inertial movement, the EURUSD currency pair came close to parity, which led to a massive fixation of short positions. As a result, the market experienced a technical pullback.
The daily trading chart shows a gradual euro depreciation since June 2021. The scale of the decline is 2,150 points, which is about 17%.
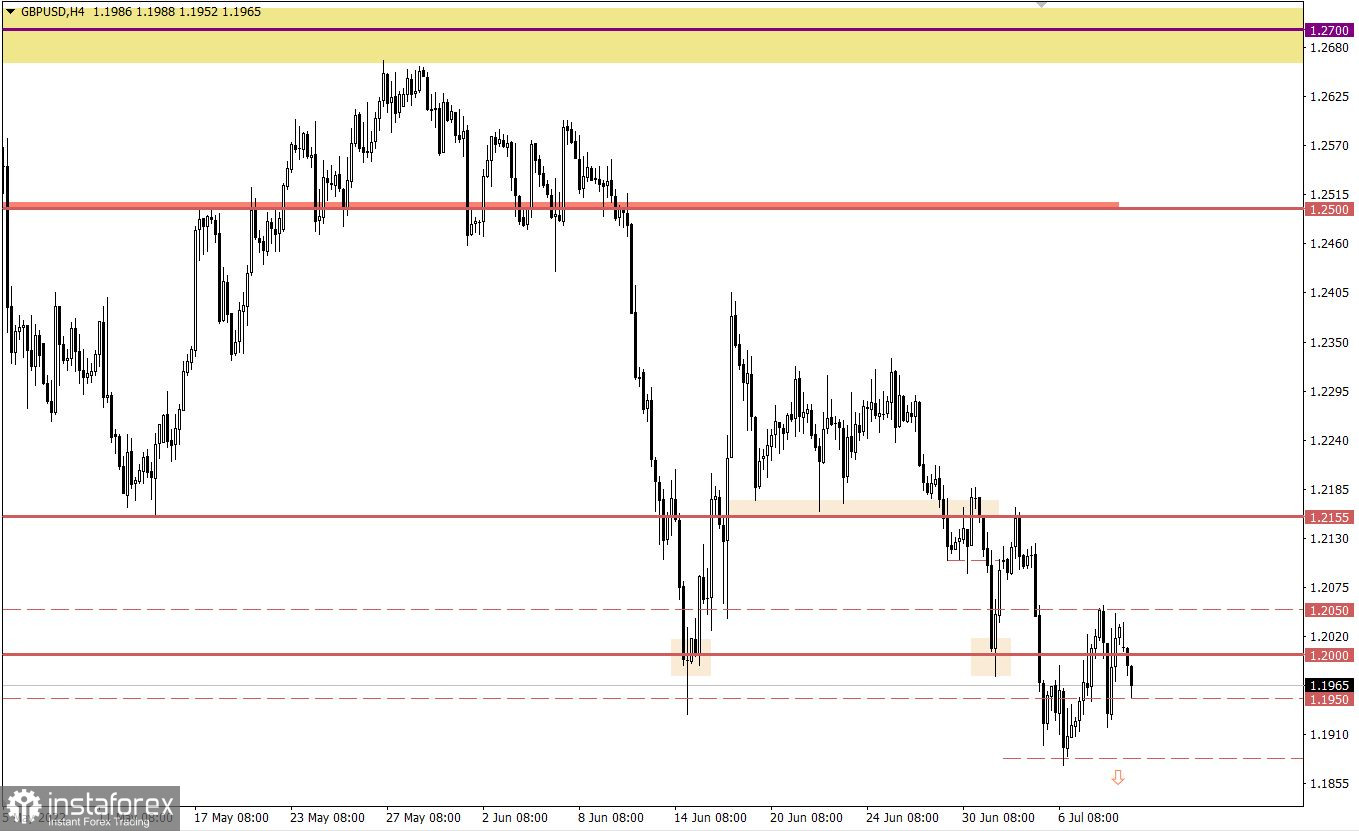
The GBPUSD currency pair, despite many attempts to resume the downward cycle, still fluctuated along the psychological level of 1.2000 (1.1950/1.2000/1.2050). This indicates an overheating of short positions, which are trying to regroup the trading forces in the stage of a change of turbulence.
On the daily timeframe, the pound sterling has been losing 16.5% of its value since June 2021, which is about 2,300 points.

Economic calendar for July 11
Monday is traditionally accompanied by an empty macroeconomic calendar. Important statistical indicators in Europe, the United Kingdom, and the United States are not expected.
Trading plan for EUR/USD on July 11
In this situation, the descending mood remains among traders. For this reason, keeping the price stable below 1.0150 increases sellers' chances for a subsequent decline (towards parity).At the same time, traders are considering the scenario of a transition from a pullback stage to a complete correction if the price holds above 1.0220 in a four-hour period.
Trading plan for GBP/USD on July 11
In this situation, all of the traders' attention is focused on the deviation levels of 1.1950 and 1.2050 since the stable holding of the price outside of one or another value, at least in a four-hour period, may indicate a subsequent price path.
What is reflected in the trading charts?
A candlestick chart view is graphical rectangles of white and black light, with sticks on top and bottom. When analyzing each candle in detail, you will see its characteristics of a relative period: the opening price, closing price, and maximum and minimum prices.
Horizontal levels are price coordinates, relative to which a stop or a price reversal may occur. These levels are called support and resistance in the market.
Circles and rectangles are highlighted examples where the price of the story unfolded. This color selection indicates horizontal lines that may put pressure on the quote in the future.
The up/down arrows are the reference points of the possible price direction in the future.


