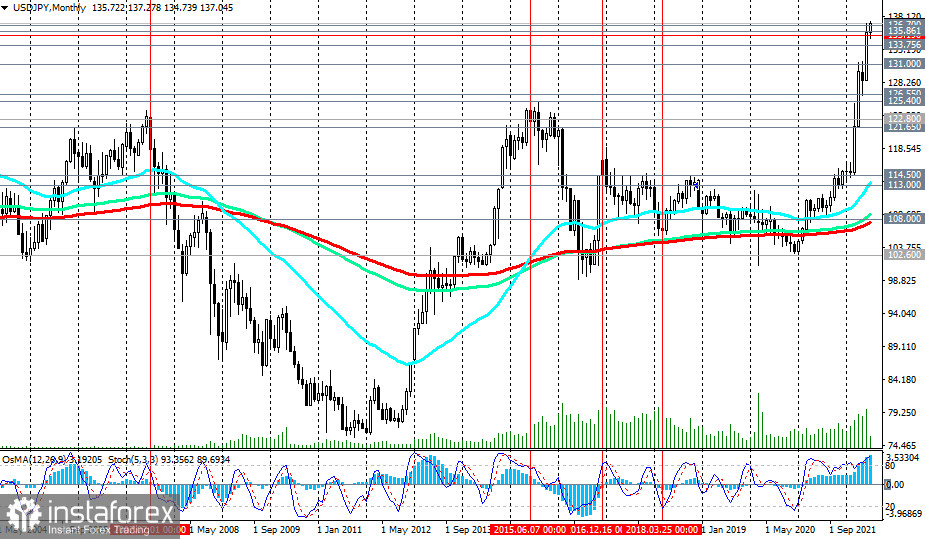
During today's Asian trading session, the USD/JPY pair broke through another psychologically significant level of 137.00, reaching an intraday local high at around 137.27. The last time USD/JPY was close to current levels was in October 1998. The pair's quotes are growing both against the backdrop of a strengthening dollar and the weak yen.
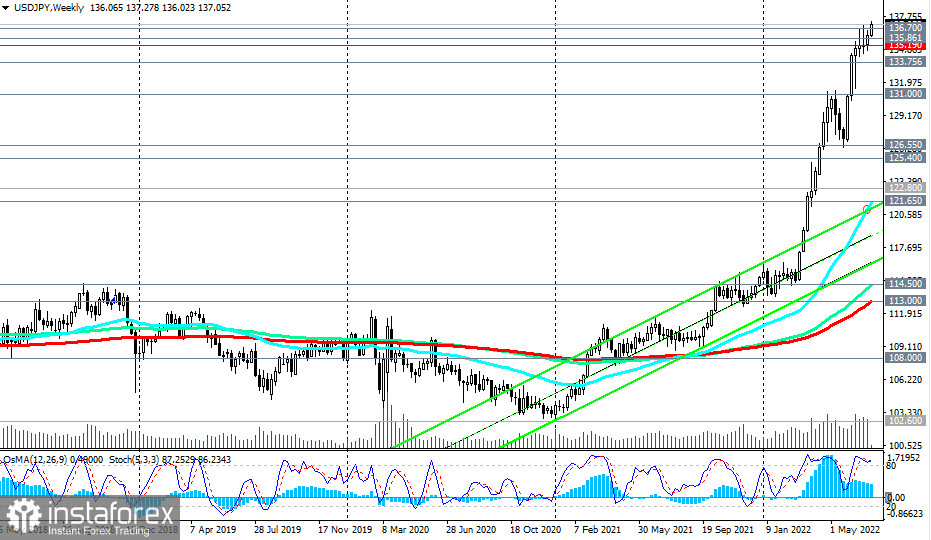
From a fundamental point of view (we suggested in our review for 07/08/2022 ), so far, everything is going exactly according to this scenario (expectations of further strengthening of the dollar), and the main factor here is the Fed's monetary policy, as we noted earlier, the most stringent (by current) compared to other major global central banks. The discrepancy between the monetary policy rates of the Fed and the Bank of Japan will most likely increase, creating preconditions for further growth of USD/JPY.
In this case, the pair will move towards multi-year highs near 140.00, reached in June 1998, and possibly higher, towards multi-year highs near 147.00, reached in August 1998.
Our previous forecast was fully justified, and the set targets (Buy Stop 125.50. Stop Loss 124.40. Take-Profit 125.65, 126.00, 127.00, 128.00, 134.00, 135.00) have been achieved. Moreover, the price rewrote the multi-year high of 137.00, reaching a new local high of 137.27.
USD/JPY is currently trading near 137.05, with potential for further gains.
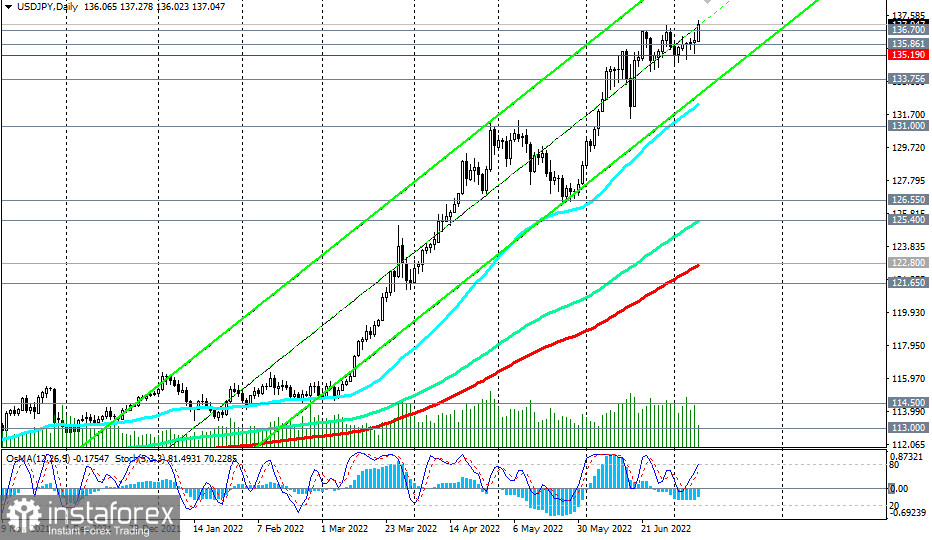
The best option would be to wait for a pullback, at least, to the support levels of 136.00, 135.86, 135.19, 135.00. Nevertheless, given the strong upward momentum, fueled, among other things, by the growing divergence in the direction of the monetary policies of the Fed and the Bank of Japan, purchases from current levels also look logical.
The breakdown of the local high at 137.27 will be a signal to increase long positions.
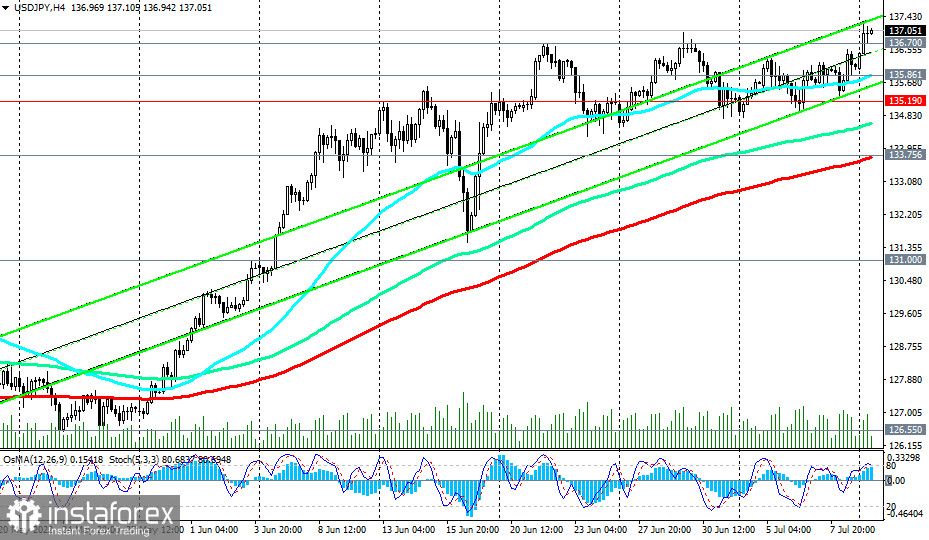
In an alternative scenario, the signal for short-term sales will be a breakdown of the support level of 135.00. The downward correction, in this case, may continue to the support level of 133.75 (200 EMA on the 4-hour chart) and even lower to the support level of 132.30 (50 EMA and the lower line of the rising channel on the daily chart), where new pending buy orders can be placed. A deeper decline is unlikely.
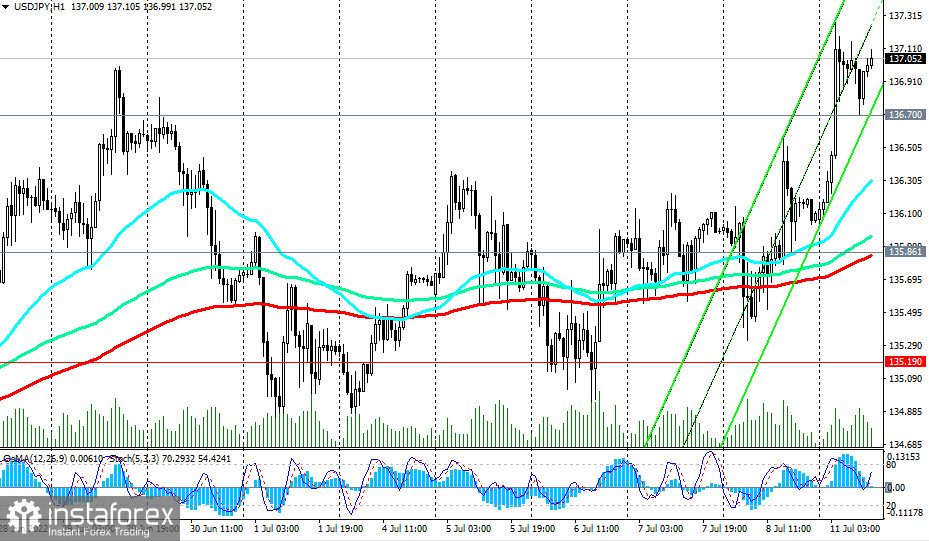
Support levels: 136.00, 135.86, 135.19, 135.00, 133.75, 132.30, 131.00, 126.55, 125.40, 122.80
Resistance levels: 138.00, 139.00, 140.00
Trading Tips
Buy Stop 137.30. Stop Loss 135.80.
Buy Limit 136.00, 135.86, 135.19, 135.00. Stop Loss 132.00.
Take-Profit 138.00, 139.00, 140.00
Sell Stop 135.80. Stop Loss 137.30. Take-Profit 135.19, 135.00, 133.75, 132.30


