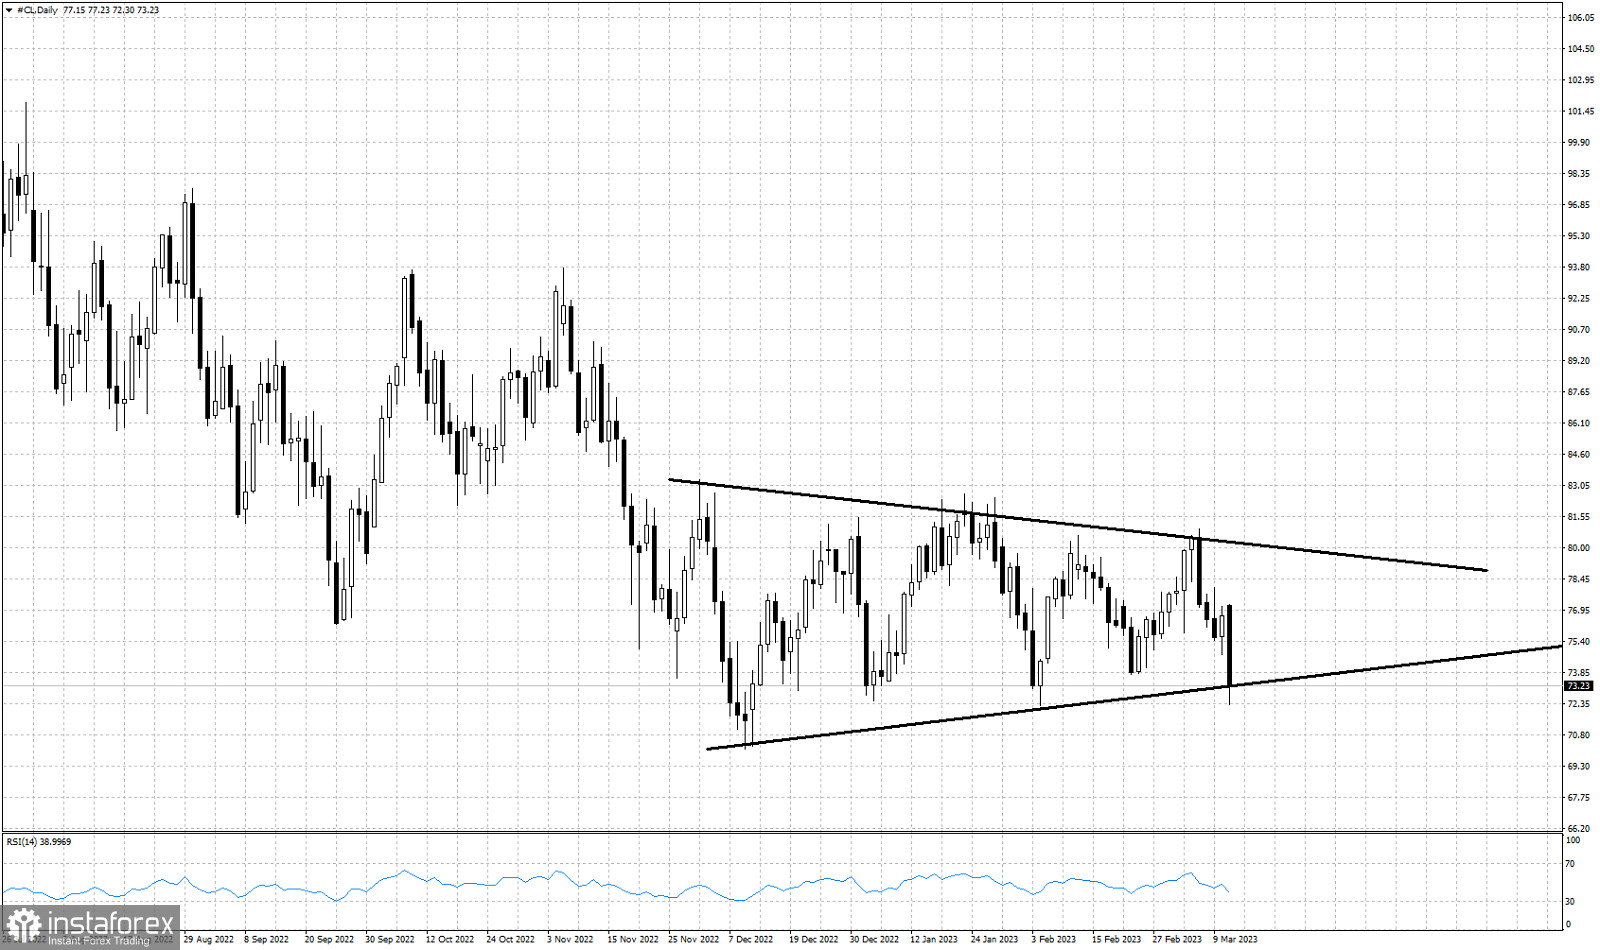
Black lines- triangle pattern
Oil price is trading around $73.50. Price is challenging key support at the lower triangle boundary. At the end of February when price was showing rejection signs at the upper triangle boundary we warned traders that a pullback towards $74-$73.50 was very possible. On our March 8th analysis we repeated that the lower triangle boundary at $73.50 was our pull back target and key support. Price can bounce from current levels towards $75-$76. Short-term trend remains bearish and price is vulnerable to more downside. However we must keep a close eye on the triangle boundary. Support there is very important and bulls could provide a bounce higher. A break below the lower triangle boundary would be a bearish sign.


