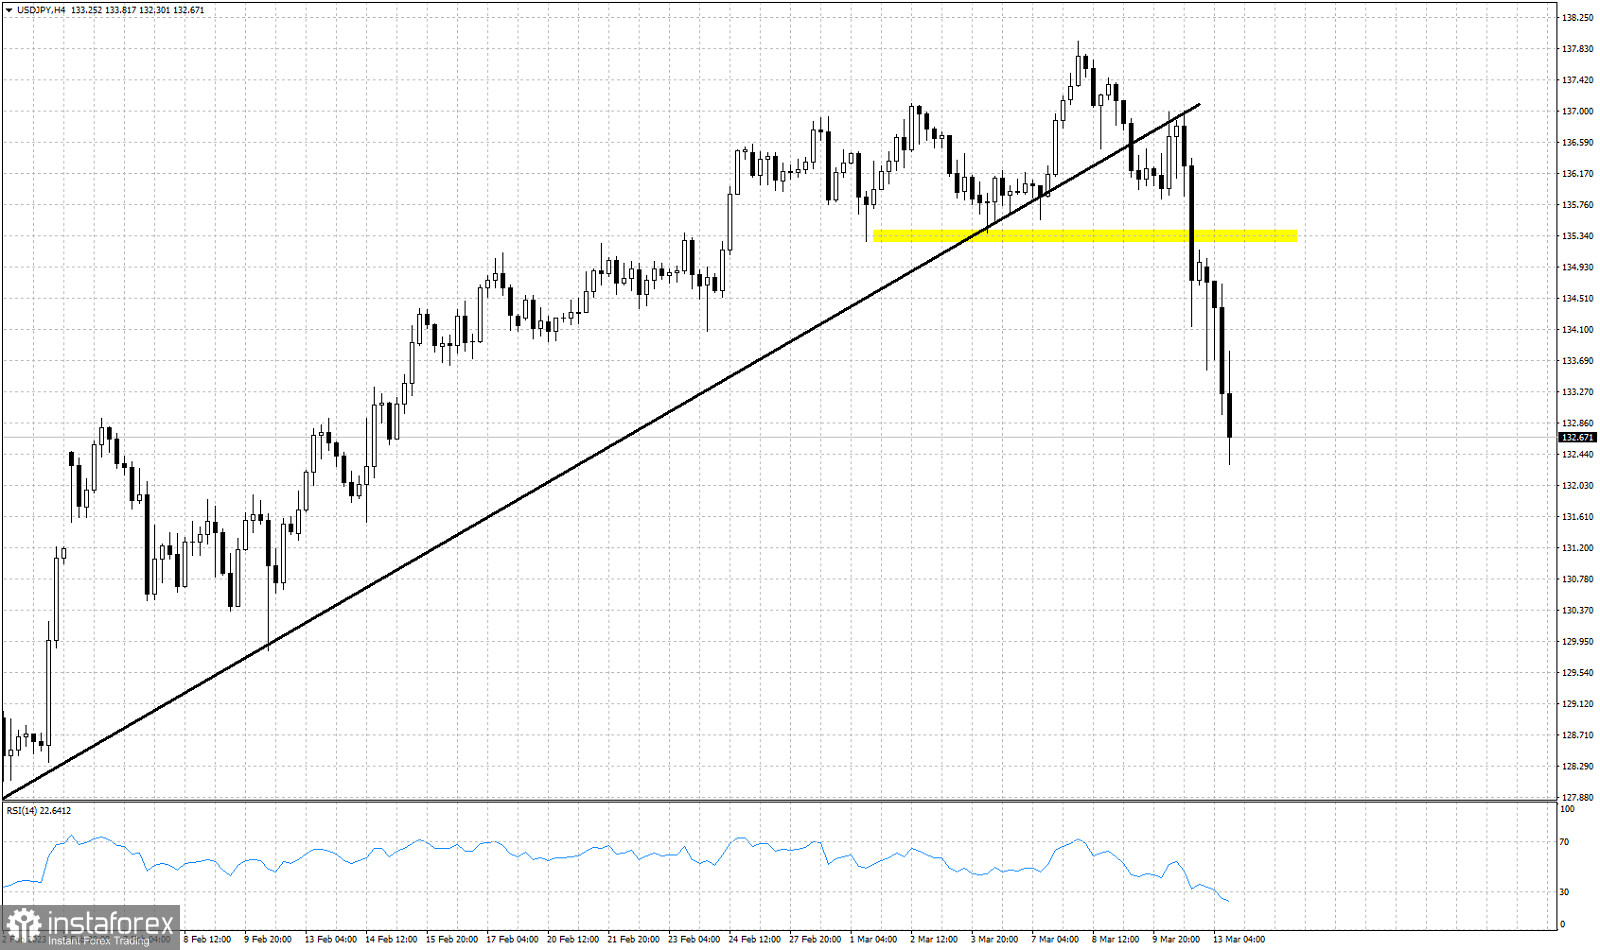
Black line -support trend line
Yellow rectangle- horizontal support
On March 10th in our analysis we warned that the back test of the broken support trend line combined with a rejection at 136.90 was a bearish sign. Not long after price was pushed even lower towards the horizontal support of 135.25. Last week price broke below the support level providing a new bearish signal. USDJPY is now trading below 133. In our analysis from March 9th we had given 132-131 as the potential pull back targets. Price is now approaching this level as the RSI enters oversold territory.


