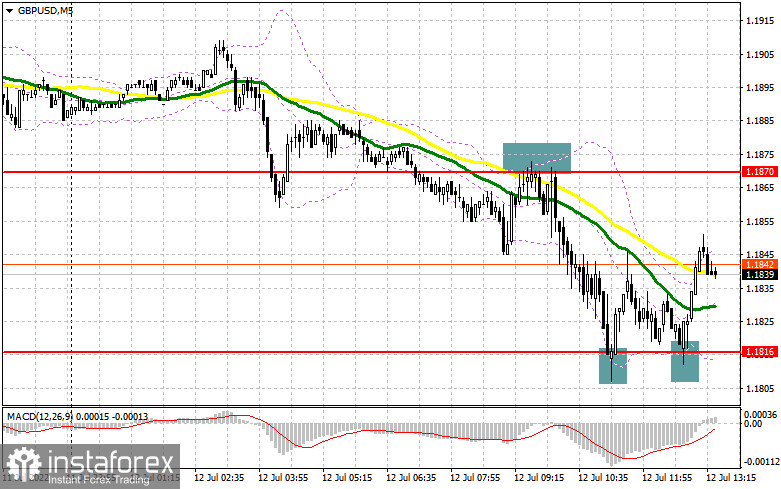
In my morning forecast, I emphasized the levels of 1.1870 and 1.1816 and advised investors to use them to make entry decisions. Let's examine the 5-minute chart to determine what transpired there. A failed attempt to return to 1.1870 in the first half of the day led to a false breakdown and a signal to sell the pound, which resulted in a significant drop to the 1.1816 region, allowing approximately 50 points of profit to be taken. There are multiple unsuccessful attempts to break below 1.1816 that generated buy signals, each indicating an increase of roughly 30 points. From a technical standpoint, nothing has changed for the second half of the day, and the strategy has not changed either.
To establish long positions on the GBP/USD, you must:
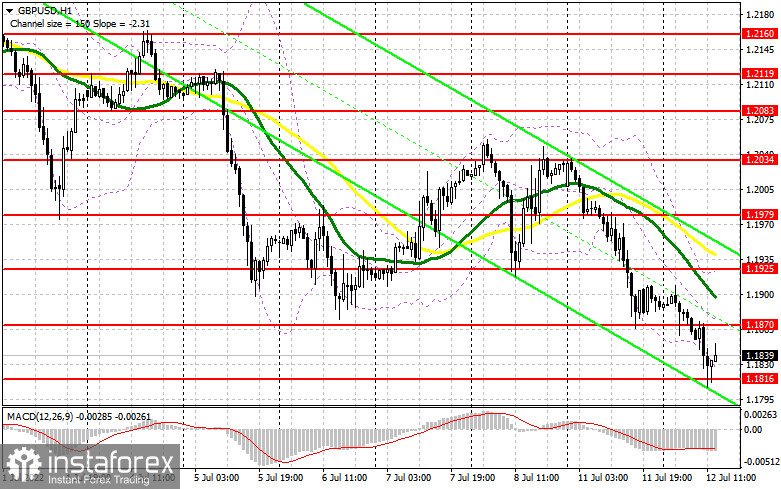
There are no reports that could contribute to the dollar's strength against the pound during the US session. However, given the current bearish trend, even the slightest positive data can trigger a further decline in the pair. The Redbook Retail Sales Index and the NFIB Small Business Business Optimism Index are anticipated. In the event of a further decline in GBP/USD, only the re-formation of a false breakdown at 1.1816, analogous to what I discussed above, will be an excellent signal to open long positions with the objective of a slight upward correction to the area of the closest resistance at 1.1870, which is highly dependent. Moving averages are crossing just above the 1.1870 level, limiting the upward potential of the pair. A breakout and test today from the top-down of this range will provide an entry point to buy with the expectation of a sharper rise and an update to 1.1925. A similar breach of this level following weak US data and the speeches of American politicians would lead to another entry point into long positions with the potential to reach 1.1979, where I would recommend taking profits. A more distant objective is the area around 1.2034, which will be an obvious attempt to halt the current bearish trend. If GBP/USD falls in the afternoon with no buyers at 1.1816, the pressure on the pair will increase. I advise delaying long positions until 1.1742 but only buying there on a false breakdown. On a rebound from 1.1647 or even lower – around 1.1575, it is possible to open long positions on GBP/USD with the goal of a 30-35 point correction within the trading day.
To open short GBP/USD positions, you must have:
Sellers accomplished the assigned task and tested the closest support at 1.1816. The primary objective for the second half of the day is to defend the 1.1870 resistance level, which could not be breached during the European session. Only the formation of a false breakdown at this level will provide an entry point for short positions in the development of a bearish scenario, with the possibility of a return to 1.1816 should GBP/USD rise in the afternoon. Fixing below this range, as well as the reverse test from the bottom up, will have a significant impact on the bulls' stop orders, creating an additional entry point for the sale of the pound with a decline to the new annual minimum of 1.1742, where I recommend fixing profits in part. The 1.1647 region is a more distant objective. With the possibility of GBP/USD appreciation and the absence of bears at 1.1870, the market will shift slightly in favor of buyers. Only a false breakdown in the next resistance area at 1.1925 will provide an entry point for short positions in anticipation of a rebound of the pair lower. If there is no trading activity at 1.1925, the pound may rise against the backdrop of stop orders being canceled by speculative sellers. In this case, I recommend delaying short positions until 1.1979, at which point you can sell GBP/USD immediately for a rebound, counting on a 30-35-point drop within a day.

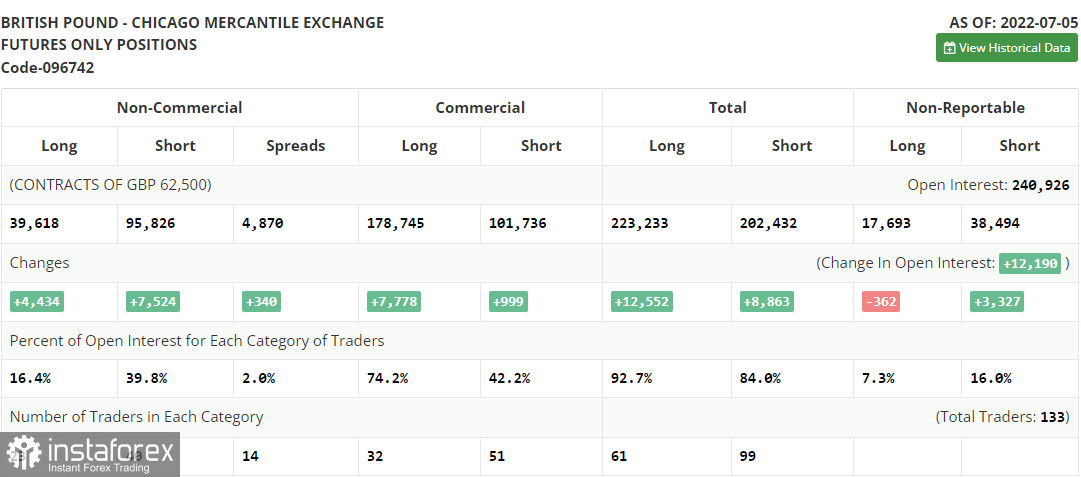
The COT report (Commitment of Traders) for the 5th of July revealed an increase in both short and long positions, but the increase in short positions was significantly larger, resulting in a rise in the negative delta. A second attempt to repurchase the annual minimum failed after it became clear that the Bank of England intends to continue fighting inflation by increasing interest rates, further slowing the British economy and pushing it into recession. The crisis of the rising cost of living in the United Kingdom continues to worsen, and the recent resignation of British Prime Minister Boris Johnson is unlikely to provide quick relief. The only prerequisite for purchasing the British pound is its updated annual lows. Since there are no such economic issues in the United States, the Federal Reserve System's policy and its rate of interest rate increases provide significantly more support for the dollar. Recent data on the US labor market for June of this year confirmed this. According to the COT report, long non-commercial positions increased by 4,434 to 39,618. In contrast, short non-commercial positions increased by 7,524 to 95,826, resulting in a rise in the negative value of the non-commercial net position to -56,208 from -53,118. The weekly closing price decreased to 1.1965 from 1.2201 last week.

Signals of indicators:
Moving Averages
The market is trading below the 30-day and 50-day moving averages, indicating the continuation of the downward trend.
The author considers the period and prices of moving averages on the hourly chart H1, which differs from the classic definition of daily moving averages on the daily chart D1.
Bollinger Bands
If the pair rises, the indicator's upper limit near 1.1925 will act as resistance.
Description of indicators- Moving average (moving average determines the current trend by smoothing out volatility and noise). Period 50. The graph is marked in yellow.
- Moving average (moving average determines the current trend by smoothing out volatility and noise). Period 30. The graph is marked in green.
- MACD indicator (Moving Average Convergence / Divergence - moving average convergence/divergence) Fast EMA period 12. Slow EMA period 26. SMA period 9
- Bollinger Bands (Bollinger Bands). Period 20
- Non-profit speculative traders, such as individual traders, hedge funds, and large institutions use the futures market for speculative purposes and to meet certain requirements.
- Long non-commercial positions represent the total long open position of non-commercial traders.
- Short non-commercial positions represent the total short open position of non-commercial traders.
- Total non-commercial net position is the difference between the short and long positions of non-commercial traders.


